Xcode's built-in view debugger highlights some of the advantages visual debugging has to offer. I hope that the previous episodes have illustrated that debugging user interface issues is more efficient with Xcode's view debugger.
Visual debugging makes a lot of sense to debug user interface issues, but it can also be applied to other types of issues. The team at Apple that builds and maintains the developer tools knows and understands this. A few years ago, the team added a brand new tool to Xcode, a visual memory graph debugger.
The memory graph debugger built into Xcode is powered by a collection of command line tools, heap, leaks, and malloc_history. These command line tools have been around for many years, but they're difficult to use if you're not comfortable using the command line. The data collected by these command line tools is processed and visualized by the memory graph debugger.
What Is the Problem
Before I show you how to take advantage of the memory graph debugger built into Xcode, I want to show you why we need such a tool. Let's start with a bit of history.
Many years ago, before the Swift programming language was a thing, the developer was responsible for managing the memory their application was consuming. This meant that objects needed to be manually retained and released. As you can imagine, such an approach is tedious and prone to errors. And it wasn't a lot of fun.
A few years ago Apple added support for Automatic Reference Counting or ARC to the Clang compiler, which meant that memory management was no longer the sole responsibility of the developer. Automatic Reference Counting isn't magical. Under the hood, the compiler figures out which objects need to be retained or released and, at compile time, it inserts the retain and release messages the developer used to add manually. The implementation is more complex than that, but that's what Automatic Reference Counting is at its core.
Automatic Reference Counting is a welcome improvement. While it may seem as if memory management is no longer an issue we need to worry about, it continues to be an important aspect of software development. Even though we no longer need to manually retain and release objects, the compiler needs a little bit of help from time to time. If we don't properly annotate the code we write, we still run the risk of creating memory issues, such as memory leaks, abandoned objects, and strong reference cycles. And that's where the memory graph debugger comes into play.
Exploring the Memory Graph Debugger
Let's revisit Cloudy. Cloudy fetches weather data from the Dark Sky API and shows the user the current weather conditions as well as a weather forecast.
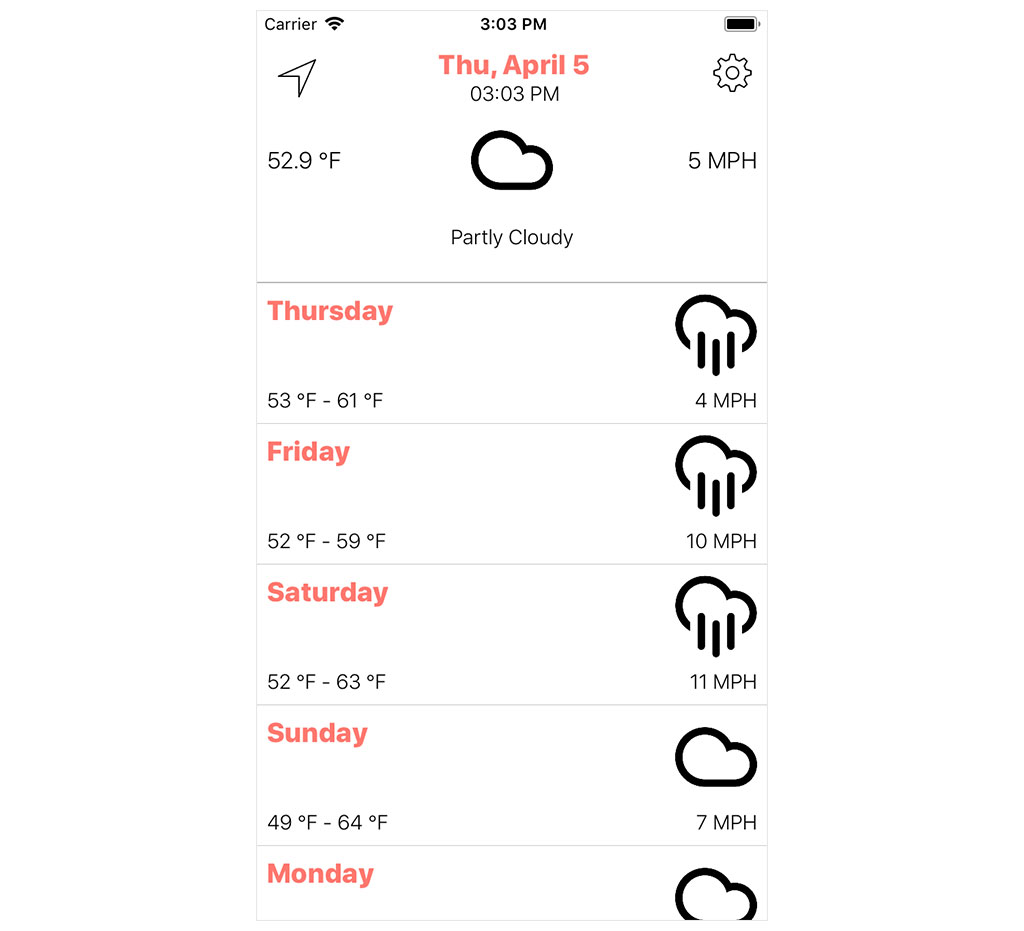
The starter project of this episode contains a few bugs, though. I introduced a few memory issues into Cloudy to illustrate how the memory graph debugger can be used to find and resolve problems related to memory management.
Download the starter project of this episode if you'd like to follow along. Let's find out how the memory graph debugger can help us debug the memory issues I introduced into Cloudy.
Run Cloudy in the simulator and click the Debug Memory Graph button in the debug bar at the bottom. The debugger pauses the application and takes a snapshot of the process of the application. You may notice that the user interface of the memory graph debugger looks familiar.
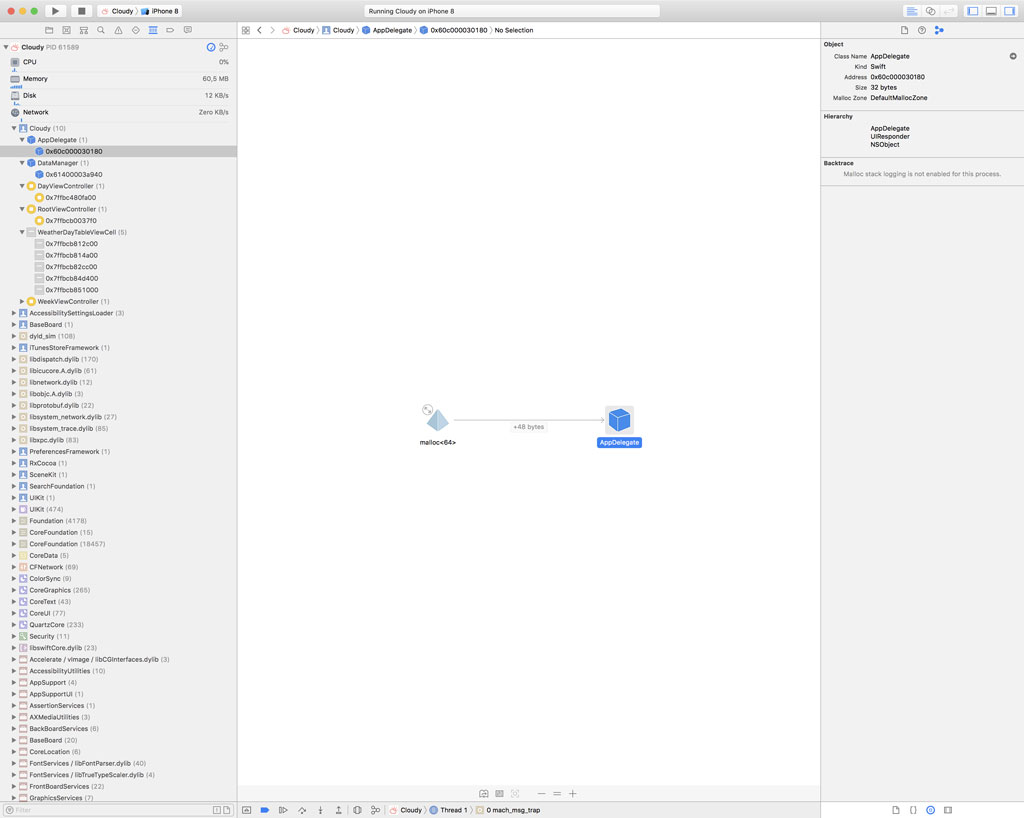
The Debug Navigator on the left doesn't display the stack trace. It shows the objects that are currently alive on the heap. The main window shows how the currently selected object in the Debug Navigator is connected to other objects. The Memory Inspector on the right displays more information about the currently selected object, such as its class name, its memory address, and the class hierarchy of the object's type.
Heap and Stack
Before we continue, I'd like to explain the differences between the heap and the stack. These terms confuse many developers and a basic understanding helps to better understand memory management and issues related to it.
The explanation I give in this episode is simplified. The goal is to highlight the differences and how the heap and the stack fit into this story. The heap and the stack are locations in memory that each have a specific purpose.
Stack
The stack is used to allocate memory for local variables, for example, when a function is invoked. The local variables of that function live on the stack. From the moment the function returns, the local variables of that function go out of scope and, as a result, the stack reclaims the memory for those local variables. You don't need to worry about the objects that live on the stack.
Heap
The heap is different. It is used for dynamically allocated objects. These objects are not linked to functions or methods. The Debug Navigator on the left shows the objects that are currently alive on the heap. The debugger takes a snapshot of the application's process and lists the object that are currently alive on the heap.
We can also ask the debugger to show us the stack trace. As the name implies, these are the functions and methods that were invoked. Each frame of the stack trace represents a function call. From the moment a function or method returns, the corresponding frame is removed from the stack. That's enough theory for now.
Debug Navigator
Let's start with the Debug Navigator. The objects in the Debug Navigator are organized by module and type. Each type lists the instances that are currently alive on the heap. We're interested in the Cloudy module because it lists the objects we defined and created.
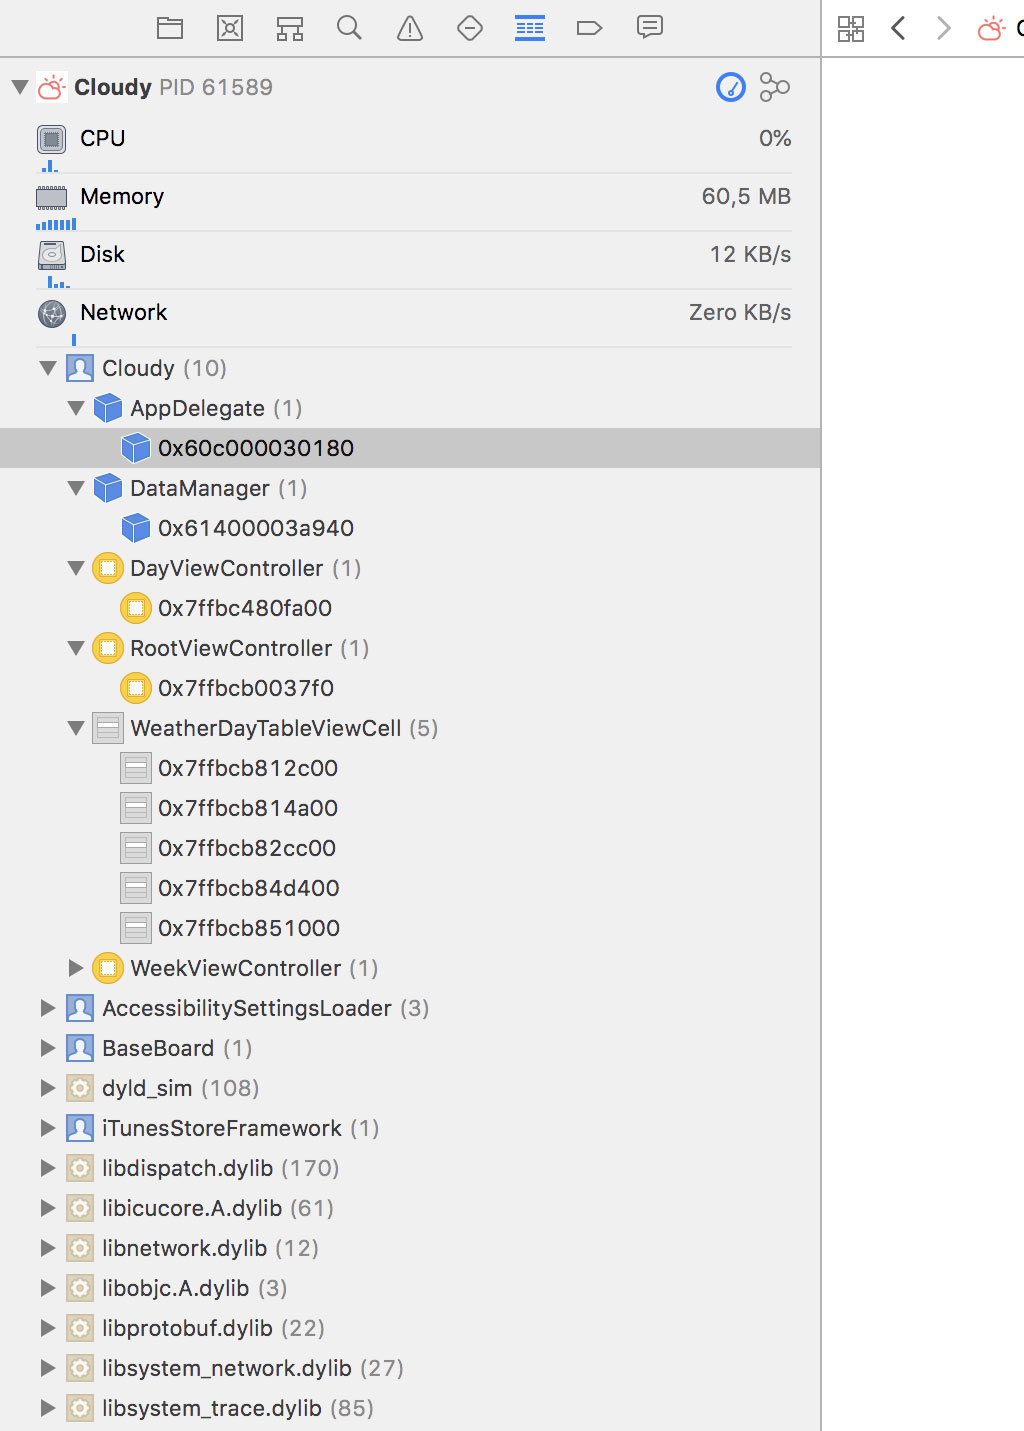
The Debug Navigator lists an instance of the AppDelegate class, an instance of the DataManager class, several view controllers, and a small collection of WeatherDayTableViewCell instances.
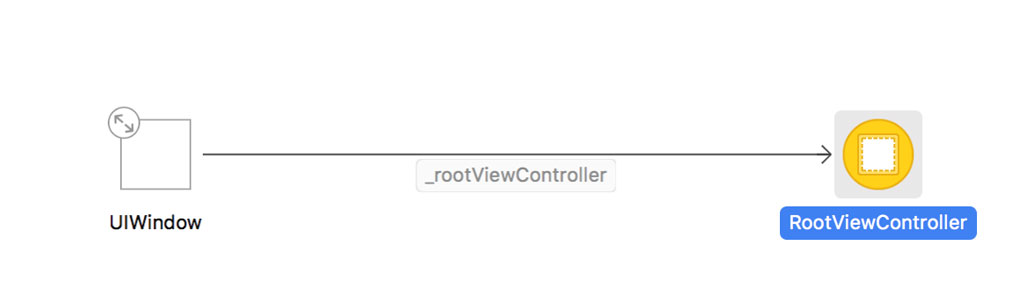
When you select the instance of the RootViewController class, the main window shows us a root analysis graph. This type of graph shows the connections the object has with other objects.
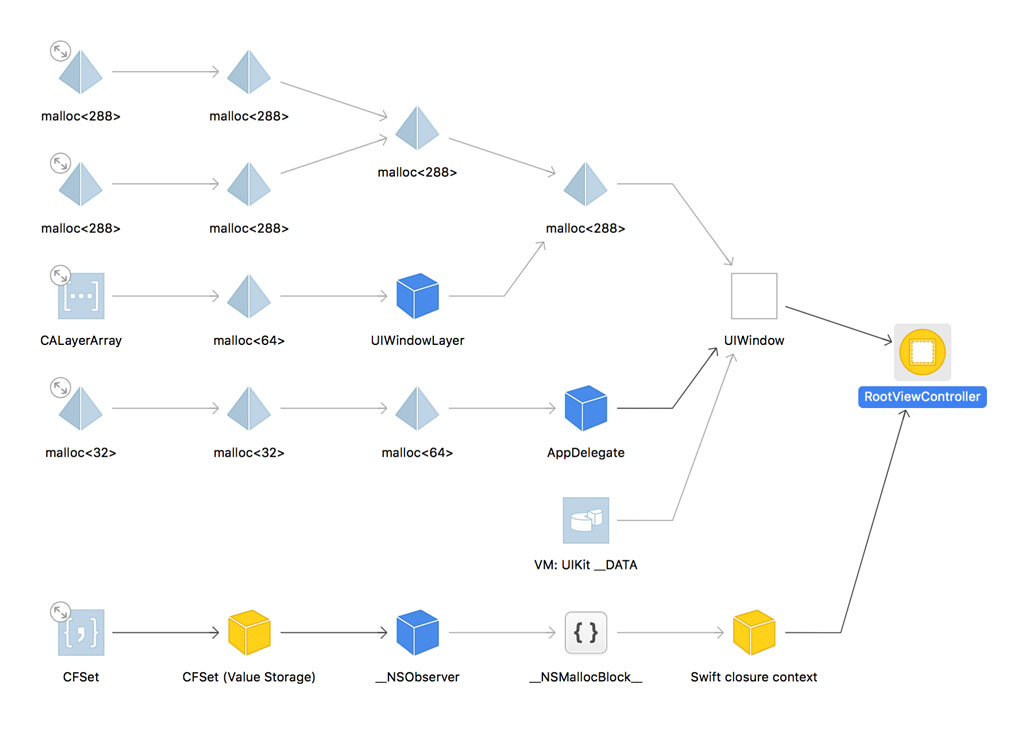
An object on the heap is only alive for as long as it is referenced by one or more other objects. In other words, the root analysis graph shows us why the RootViewController instance is still alive on the heap.
It shows us that an instance of the UIWindow class keeps a reference to the RootViewController instance. This isn't surprising since the RootViewController class is the initial view controller of the main storyboard and it's set as the root view controller of the application's window.
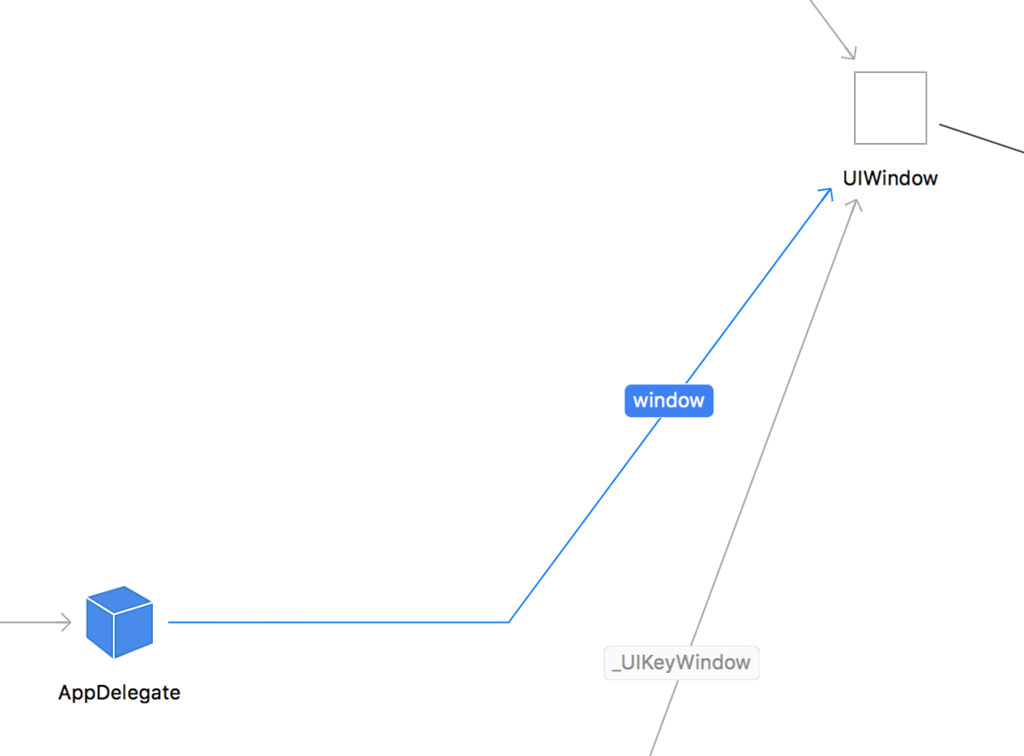
We also see that the UIWindow instance is owned by the AppDelegate instance, the delegate of the application. If we zoom in, we see that the window property of the AppDelegate class stores a reference to the UIWindow instance.
But there's another object that holds a reference to the RootViewController instance. This is suspicious since the RootViewController instance shouldn't be referenced by any other object.
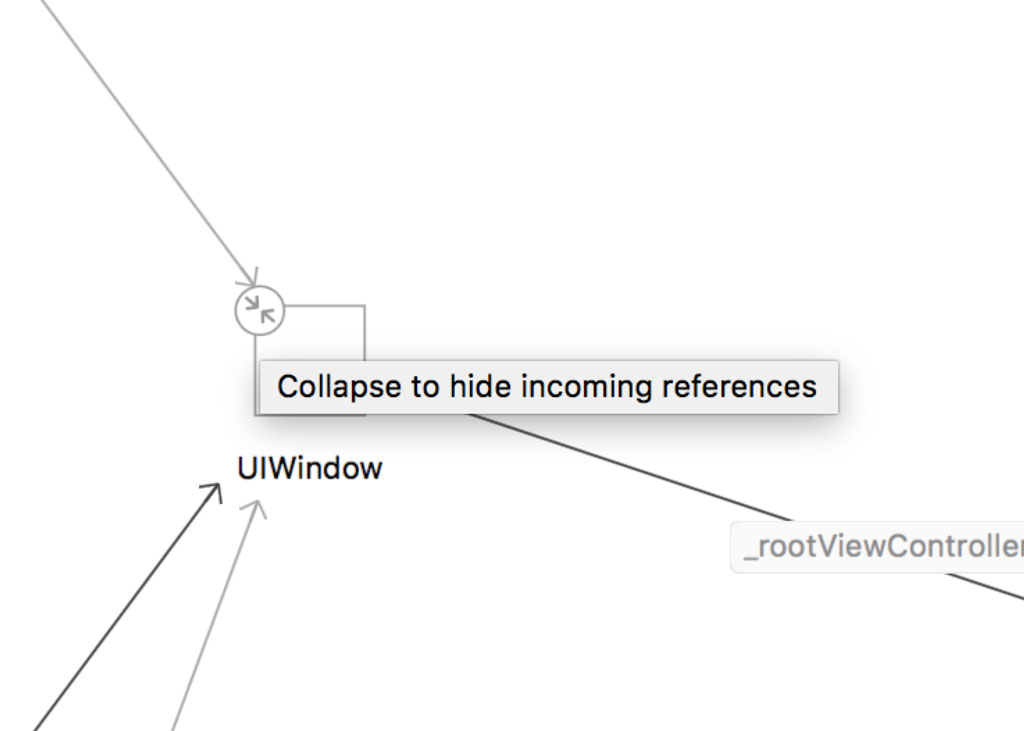
Click the collapse button in the top left of the UIWindow instance to hide the incoming references of the UIWindow instance. It makes it easier to focus on what's important. You can click the expand button in the top left of an object to show its incoming references.
Select the object named Swift closure context and open the Memory Inspector on the right. Even though the name hints at the type of the object, a closure, it's not clear where we need to start looking to find out more about this reference.
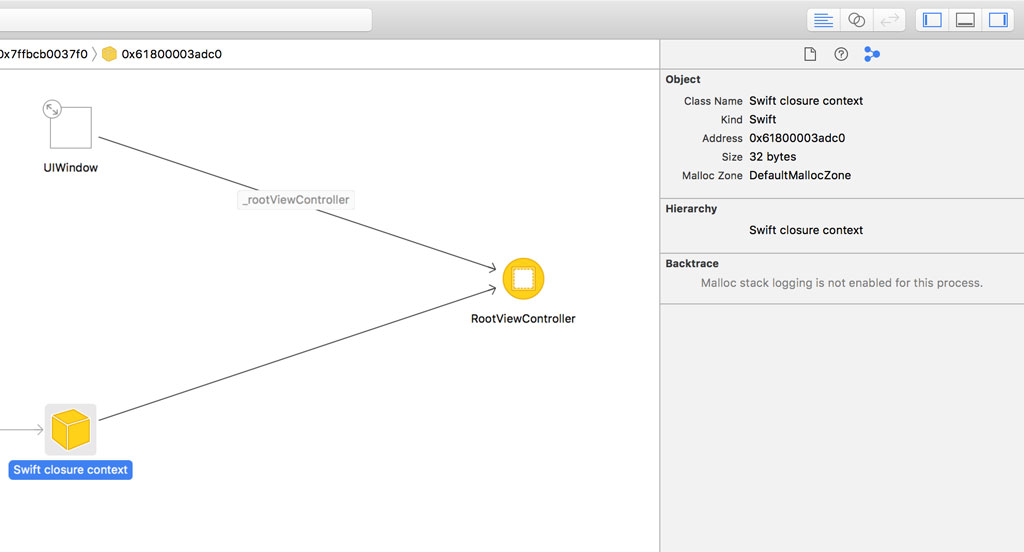
The Backtrace section of the Memory Inspector can help us, but it's empty at the moment. The backtrace shows the allocation history of the object. In other words, it shows us a trace of how the object came into existence. That information can sometimes be invaluable to debug memory issues.
This feature of the memory graph debugger isn't enabled by default. We need to enable malloc stack logging to inspect the allocation history of the object. This may sound complex, but it really isn't.
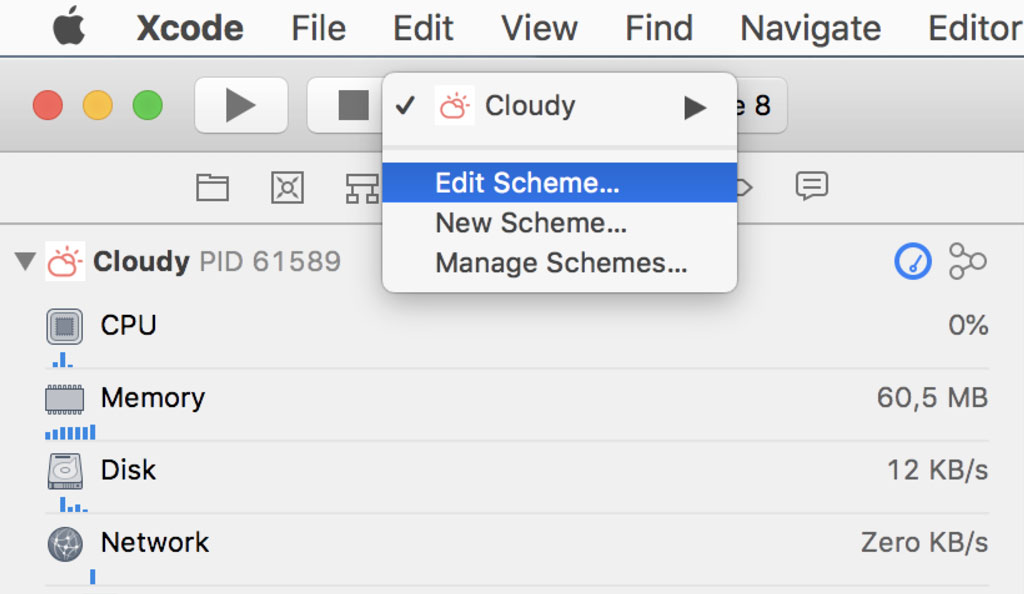
Click the current scheme and choose Edit Scheme... from the list of options.
Click Run on the left and select the Diagnostics tab at the top. We need to check the checkbox labeled Malloc Stack in the Logging Section.
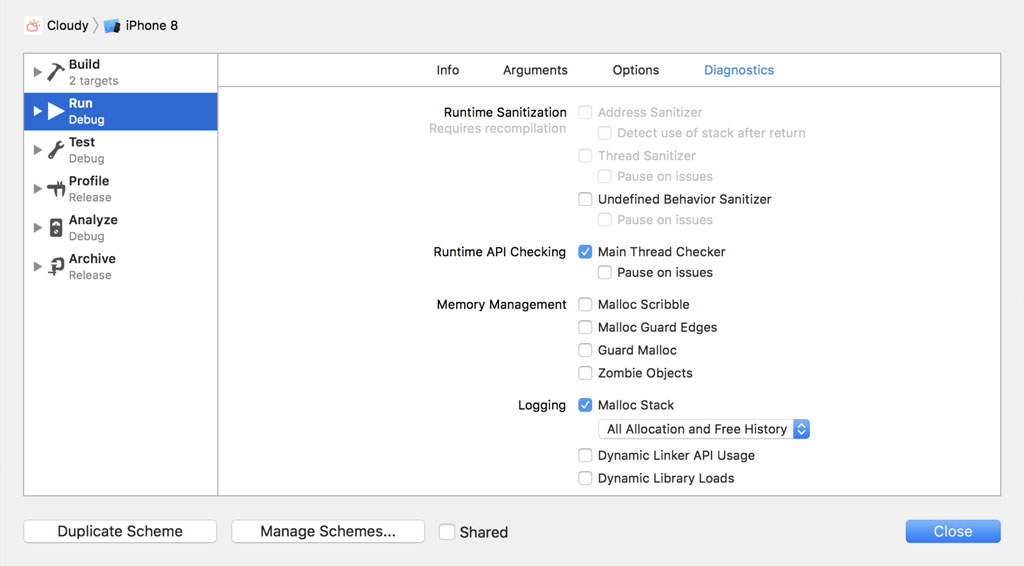
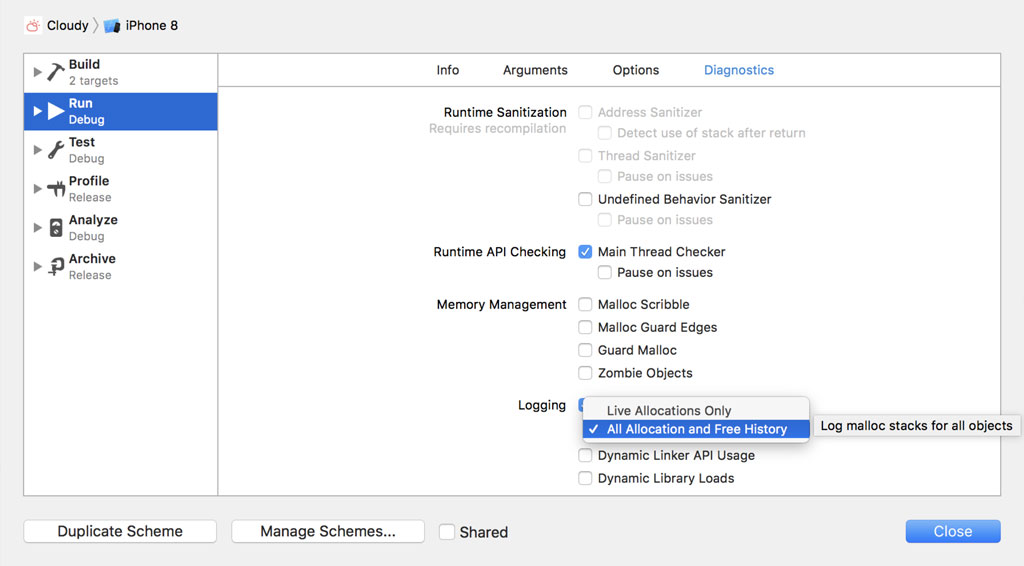
We can choose between Live Allocations Only and All Allocations and Free History. If we choose the first option, only the allocation history of objects that are still alive are logged. If we choose the second option, the allocation history of every object is logged. Choose All Allocations and Free History. Which option you choose isn't important for this example. Click the Close button and run the application again. Click the Debug Memory Graph button and select the RootViewController instance.
Select the Swift closure context object that references the RootViewController instance and open the Memory Inspector on the right. The Memory Inspector now displays the allocation history of the object.
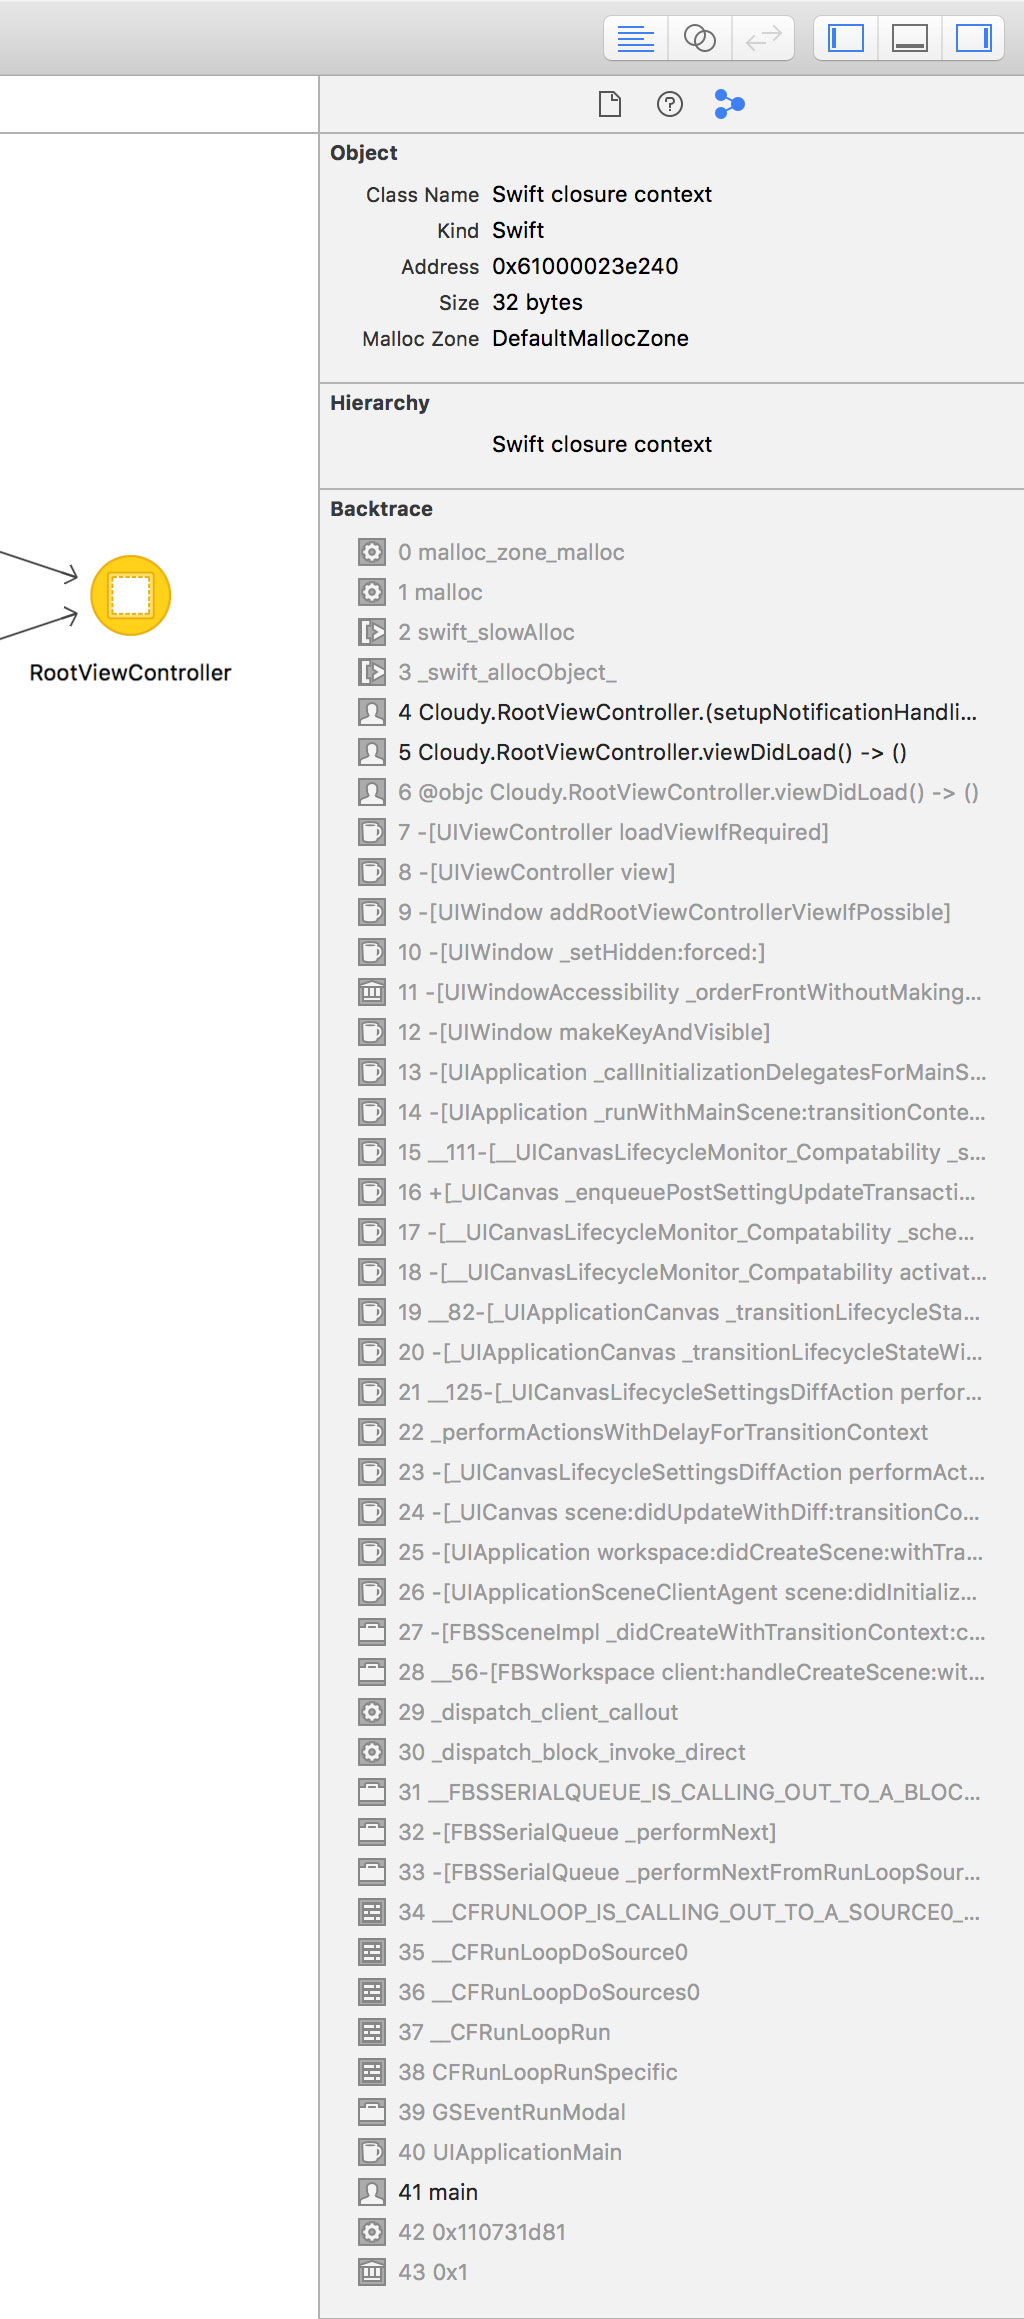
Click the Collapse button in the top right of the backtrace to only show the frames that are of interest to us.
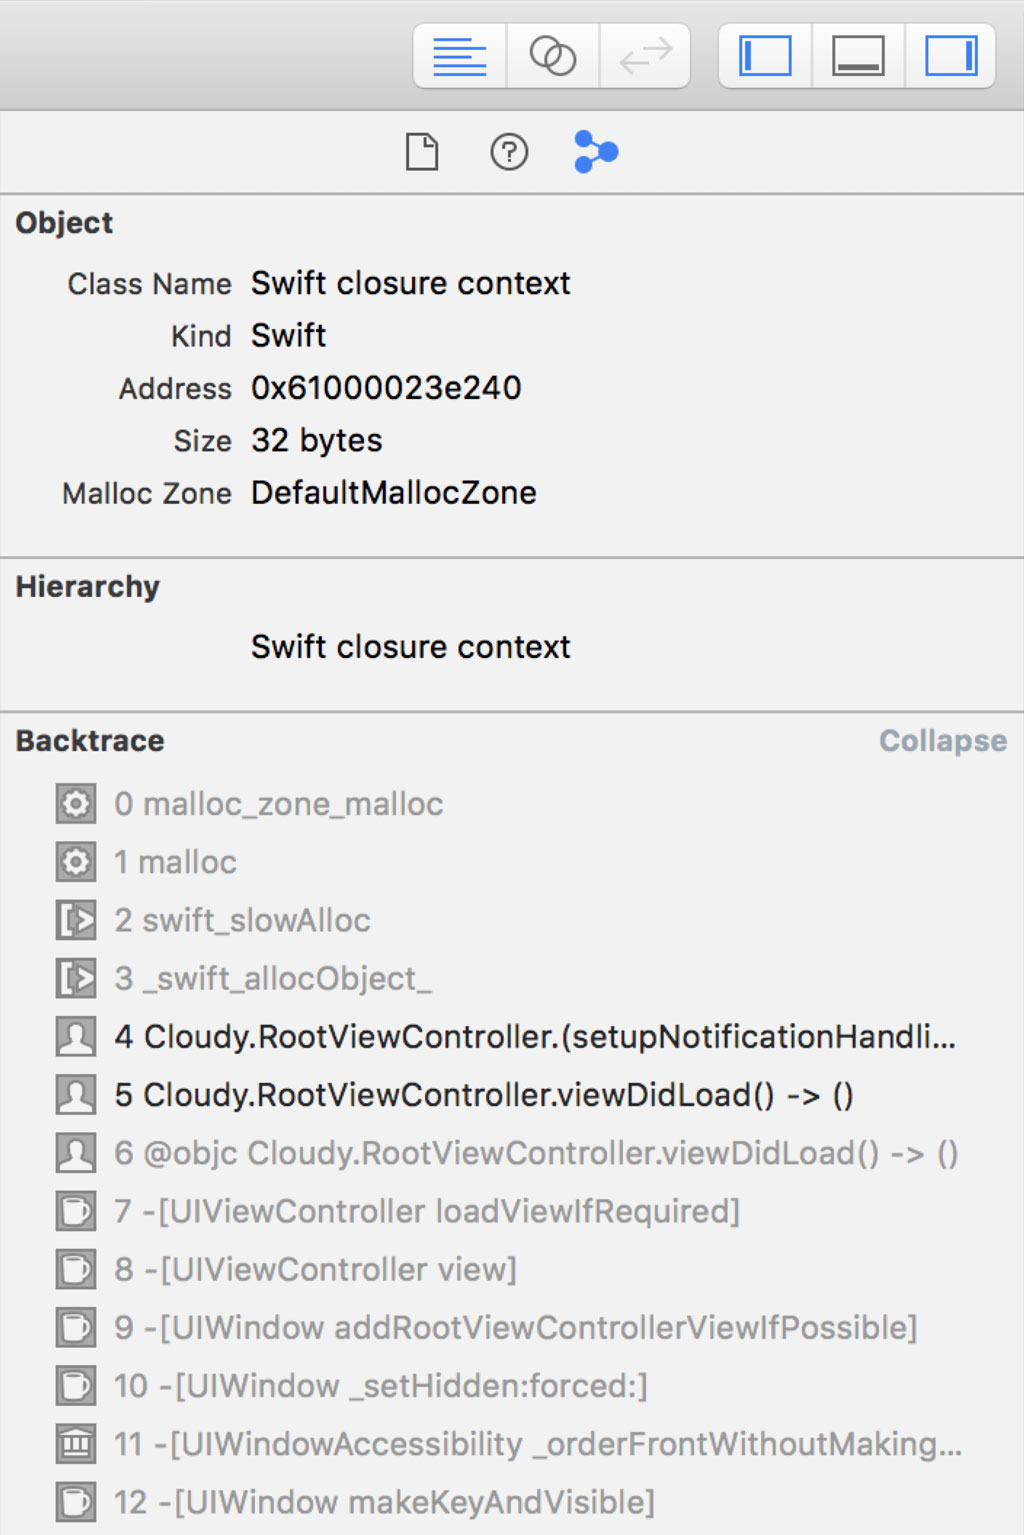
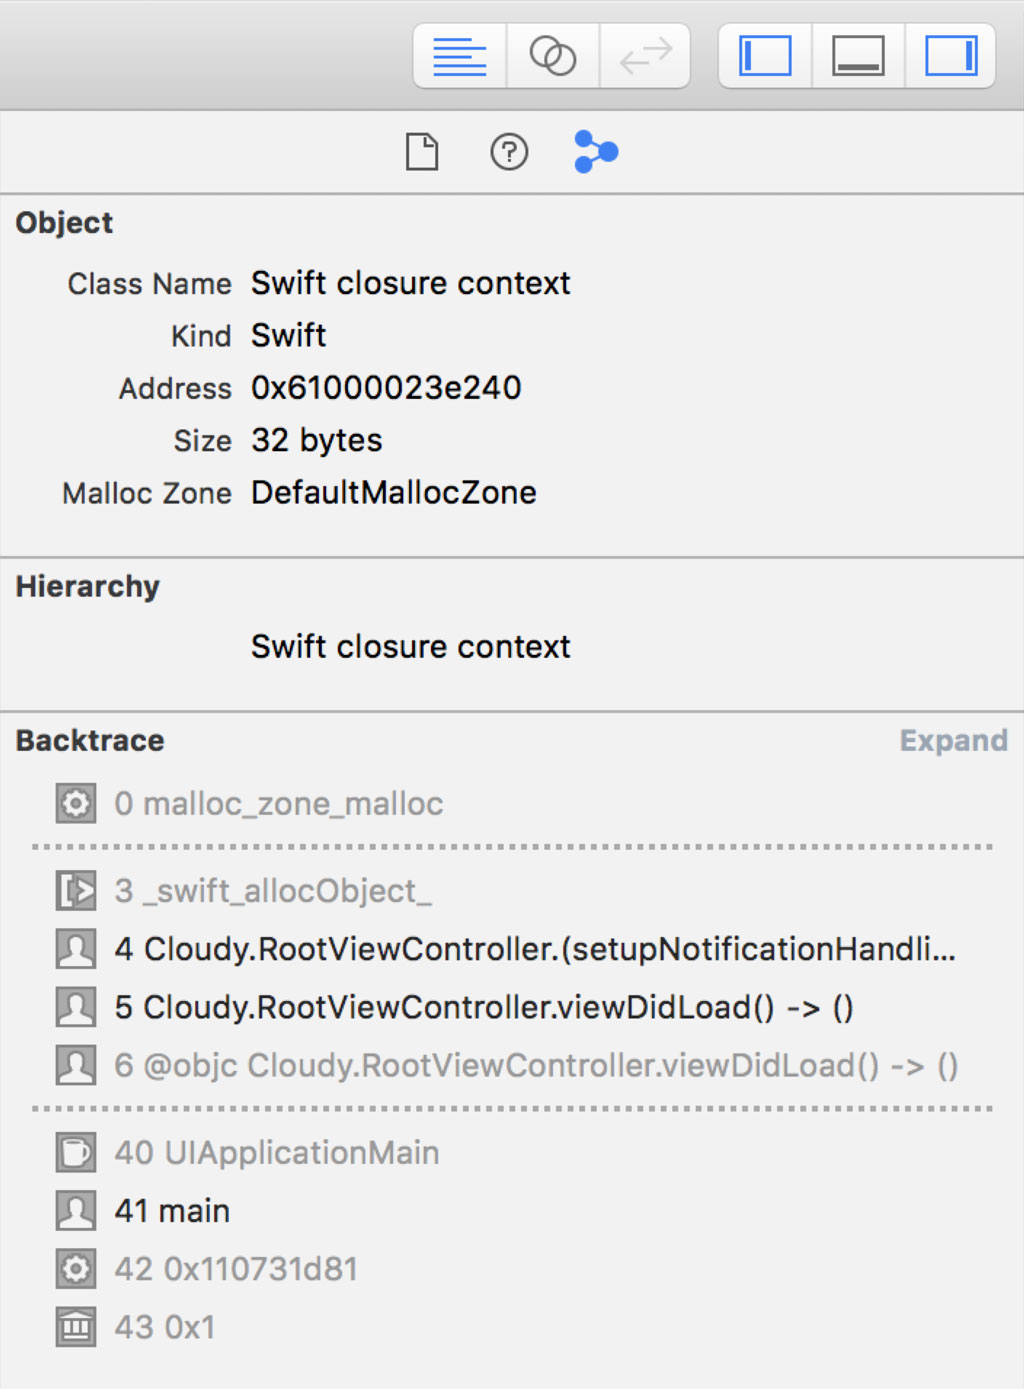
The backtrace reveals that setupNotificationHandling() is invoked in the viewDidLoad() method of the RootViewController class. It's in the setupNotificationHandling() method that the closure is created.
If you hover over the frame, a small arrow appears on the right. Click the arrow to navigate to the implementation of the setupNotificationHandling() method.
In this method, we add the view controller as an observer of the default notification center for notifications with name UIApplicationDidBecomeActive. The last argument of the addObserver(forName:object:queue:using:) method is a closure. This closure is invoked every time a notification with name UIApplicationDidBecomeActive is received. In the closure, we invoke the requestLocation() method of the RootViewController class to update the current location of the device.
private func setupNotificationHandling() {
    NotificationCenter.default.addObserver(forName: .UIApplicationDidBecomeActive, object: nil, queue: nil) { (_) in
        self.requestLocation()
    }
}
Do you see any problems with the implementation of the setupNotificationHandling() method? We reference self in the closure, which refers to the RootViewController instance. In other words, the closure keeps a reference to the RootViewController instance. That reference is strong by default and that's not what we want. We don't want the closure to strongly reference the RootViewController instance.
To resolve the problem, we need to use a capture list and weakly capture the RootViewController instance.
private func setupNotificationHandling() {
    NotificationCenter.default.addObserver(forName: .UIApplicationDidBecomeActive, object: nil, queue: nil) { [weak self] (_) in
        self?.requestLocation()
    }
}
I won't cover capture lists and reference cycles in this tutorial. There's another Cocoacasts tutorial that covers these topics in more detail. Weakly capturing self turns the reference to the RootViewController instance into an optional. This isn't a problem thanks to optional chaining.
Let's see if we fixed the memory issue. Run the application one more time and click the Debug Memory Graph button in the debug bar. Select the RootViewController instance and inspect the root analysis graph.
That looks better. The root analysis graph confirms that the fix we applied worked. The RootViewController instance is only referenced by the UIWindow instance, the window of the application.
What's Next?
In the next episode, we continue hunting for memory issues in Cloudy. I also show you how the memory graph debugger can help find memory issues at runtime. The truth is that we accidentally stumbled upon the memory issue we resolved in this episode. Xcode's memory graph debugger is smart and it can help you find memory leaks at runtime.