When you're debugging a complex problem, you quickly end up with dozens of breakpoints scattered across your project or workspace. I'd like to start this episode by showing you how you can stay on top of the breakpoints in a project or workspace.
Breakpoint Scope
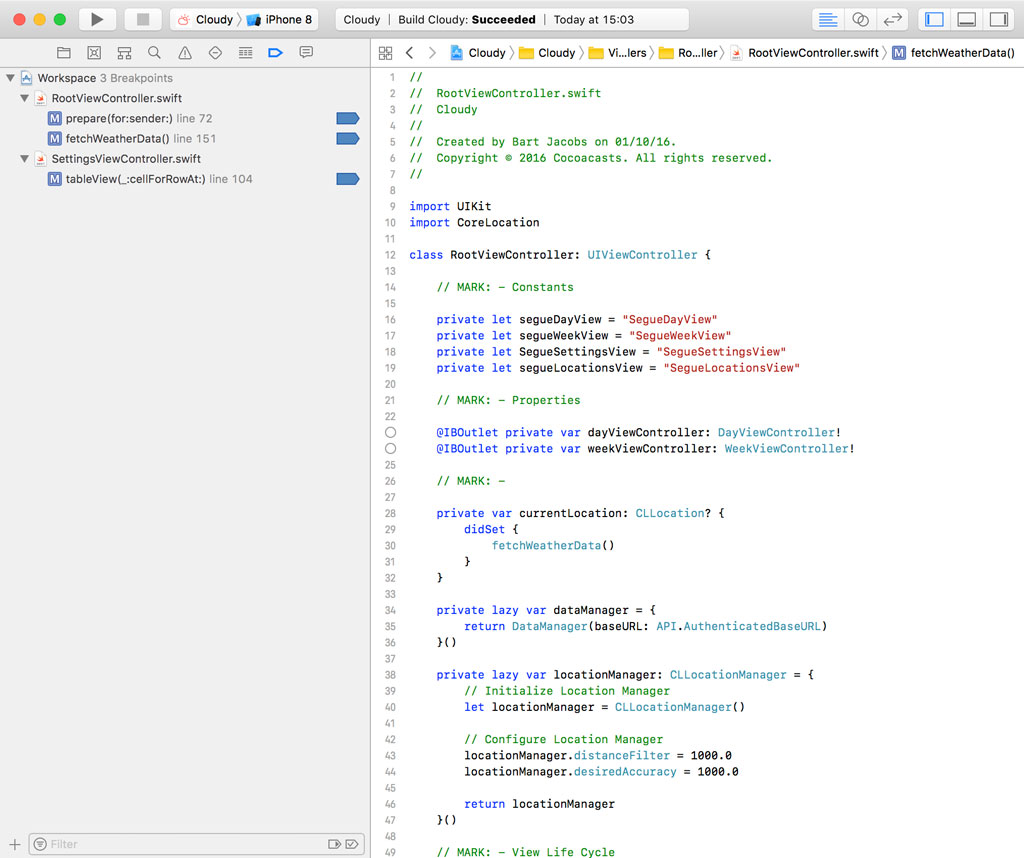
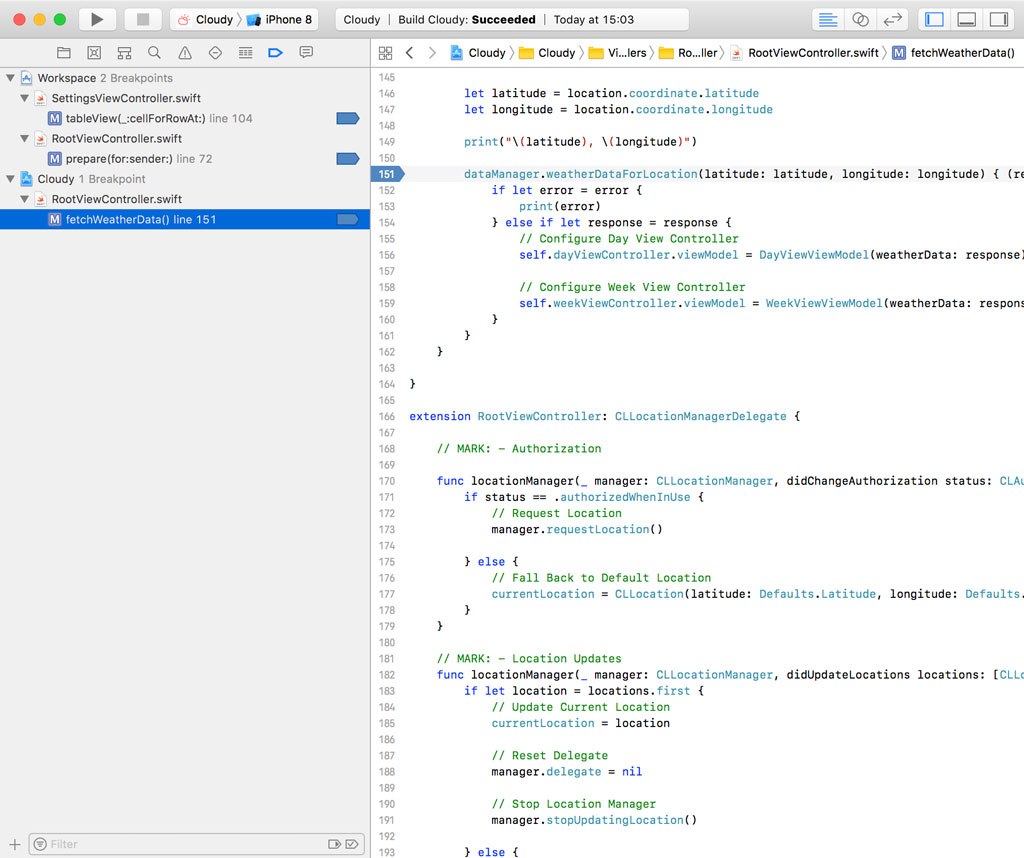
The Breakpoint Navigator on the left shows you an overview of the breakpoints set in the project or workspace. The Breakpoint Navigator lists the breakpoints by scope and by file.
Workspace Scope
Every breakpoint has a scope. The breakpoints in this example are linked to the workspace in which the Cloudy and the Pods projects live. We can change the scope of a breakpoint by right-clicking the breakpoint and choosing Move Breakpoint To from the menu. We have several options.
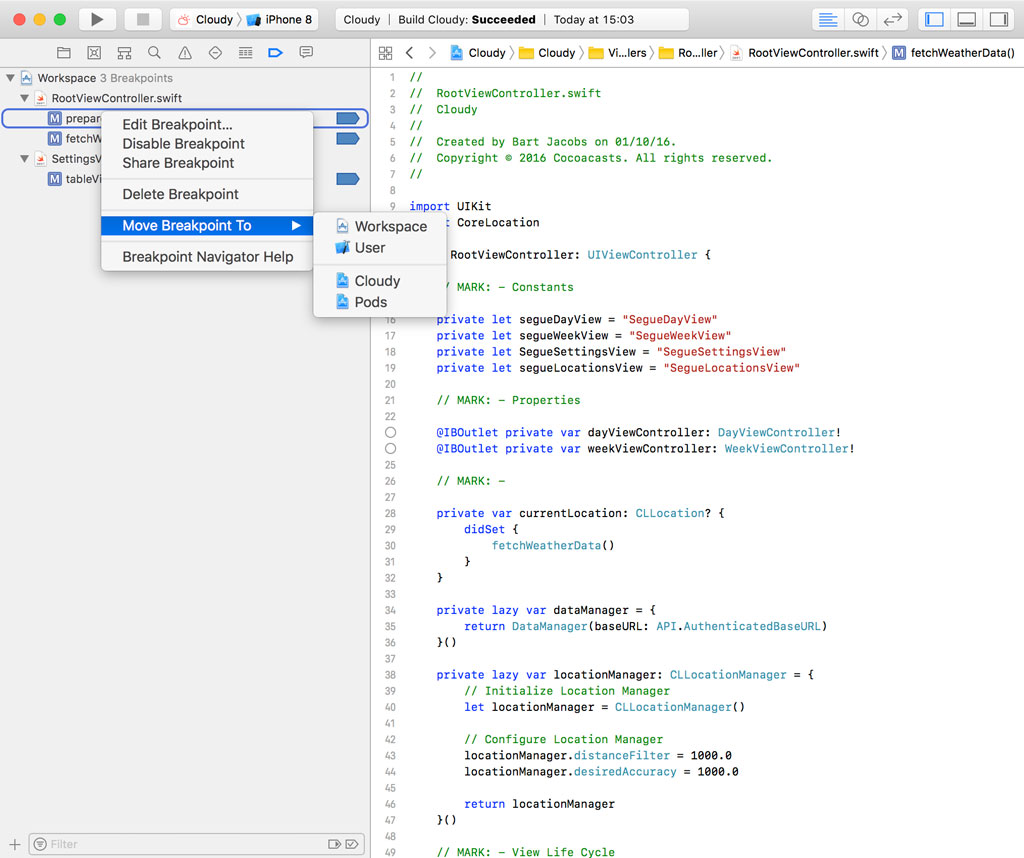
We can change the scope to one of the projects of the current workspace, Cloudy or Pods, we can leave the scope local to the current workspace, or we can change the scope of the breakpoint to User.
What is the scope of a breakpoint and what does it mean to change the scope of a breakpoint? The breakpoints in this example have a workspace scope, which means that the breakpoints are defined in the workspace. This is indicated in the Breakpoint Navigator on the left. Let me show you what that means.
Close the workspace and open the Cloudy project, not the workspace.
Project Scope
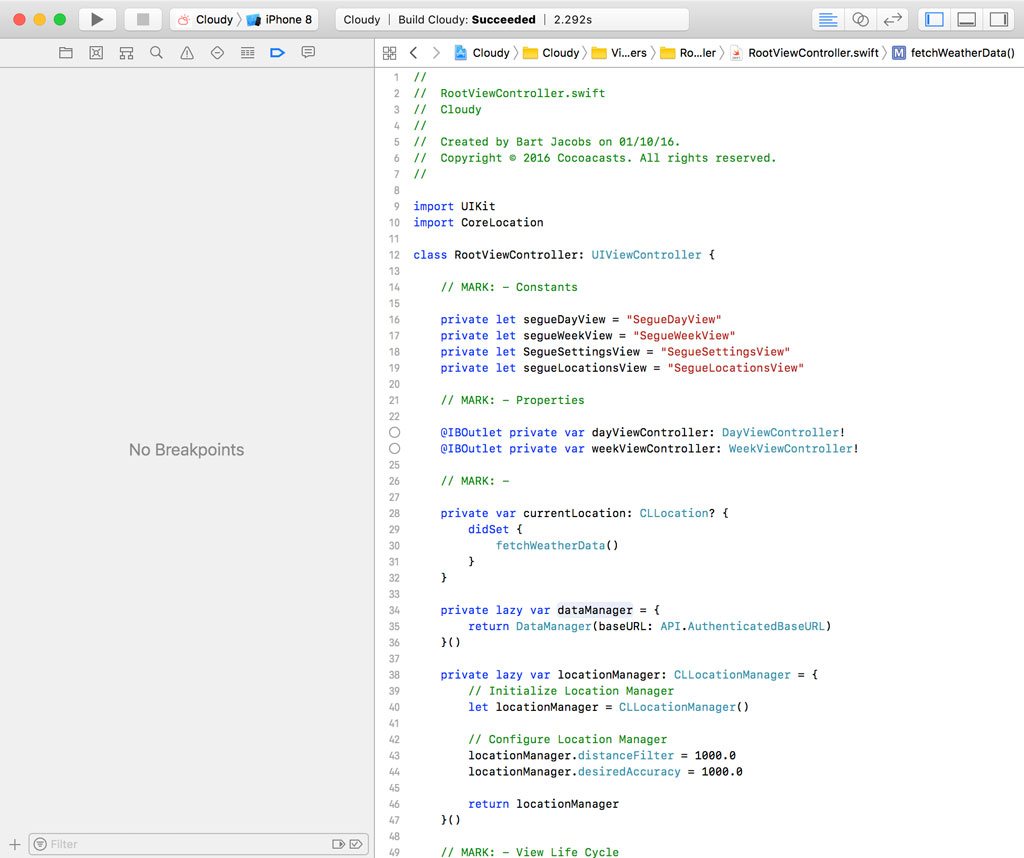
If we open the Breakpoint Navigator on the left, we won't find the breakpoints we set earlier because they are tied to the workspace in which the Cloudy project lives.
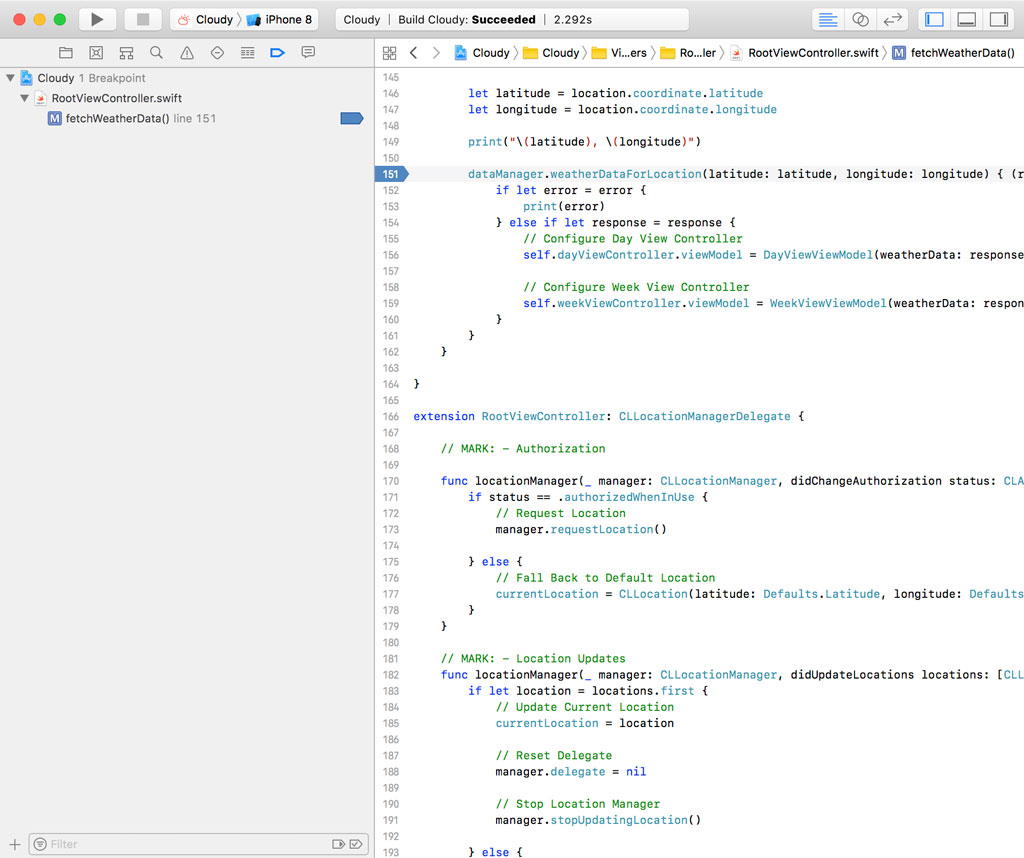
Close the project and open the workspace in which the Cloudy project is contained. Right-click one of the breakpoints, choose Move Breakpoint To, and choose Cloudy from the list of options.
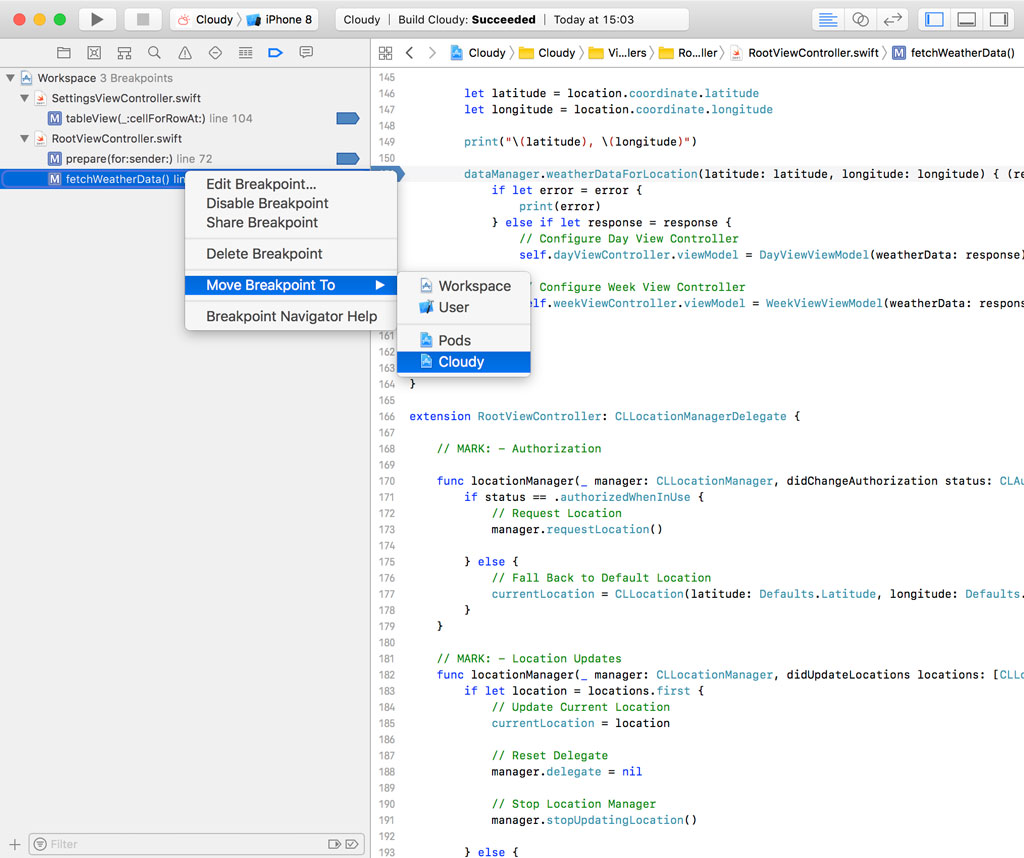
Notice that the breakpoint is no longer owned by the workspace. It shows up below the Cloudy project because we changed its scope from workspace to project.
Close the workspace and open the Cloudy project one more time. If we open the Breakpoint Navigator, we see the breakpoint we moved to the Cloudy project.
The idea is simple. A breakpoint is only available in the scope in which it is defined. The Cloudy project includes one breakpoint because we moved it from the workspace to the Cloudy project. It's also available in the workspace the Cloudy project is contained in.
User Scope
There's another option we didn't discuss yet. You can move breakpoints to a user. A breakpoint with user scope is available in every project or workspace the source file is used in. This isn't an option you use very often, though.
Sharing Breakpoints
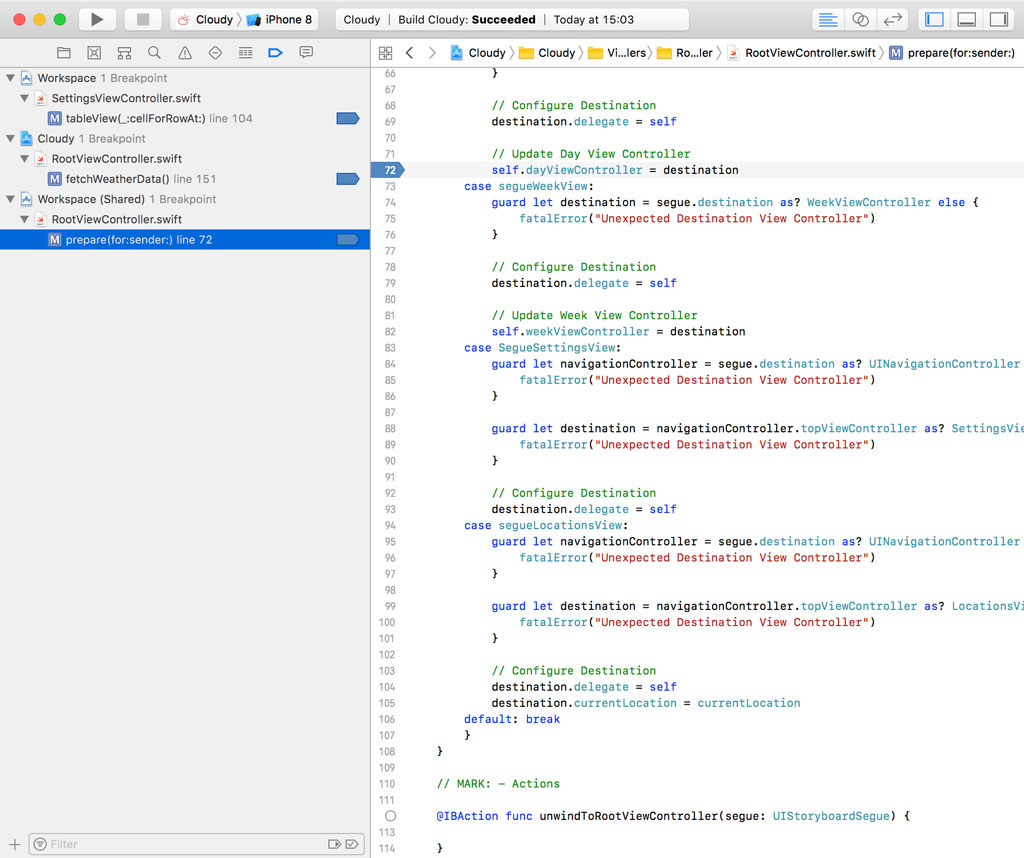
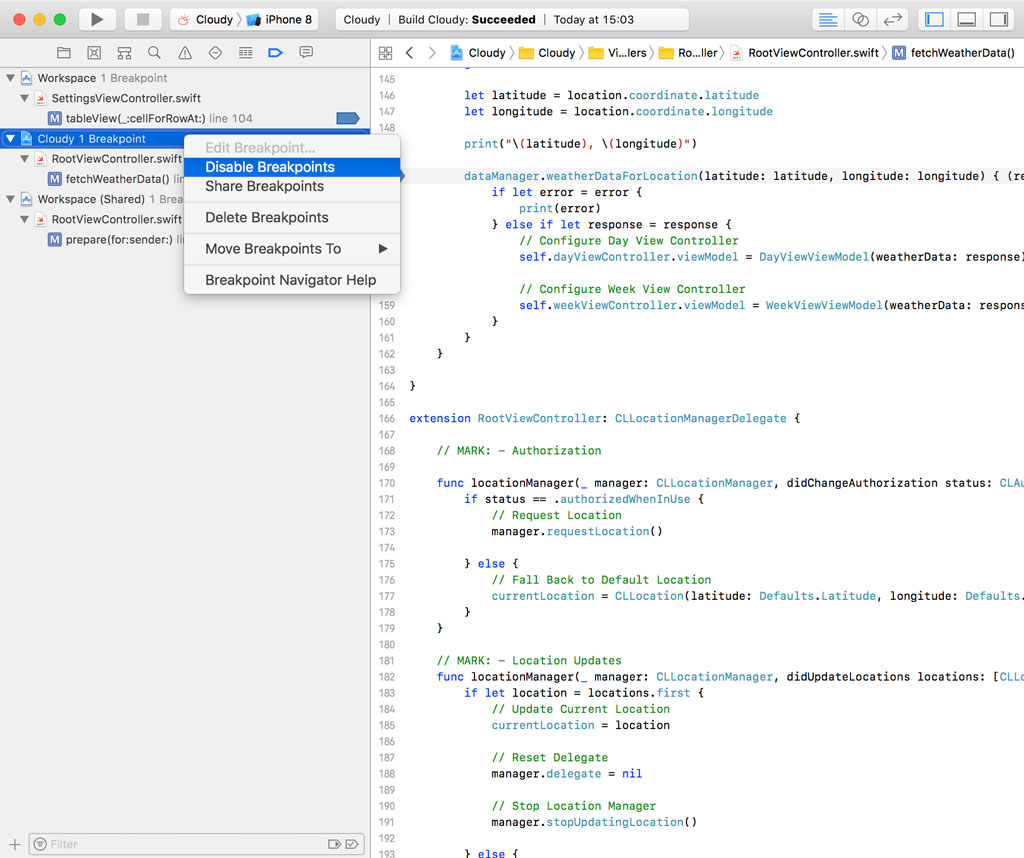
If you're debugging a problem and you want the help of a colleague, it can be useful to share one or more breakpoints. You can share a breakpoint by right-clicking the breakpoint in the Breakpoint Navigator and choosing Share Breakpoint.
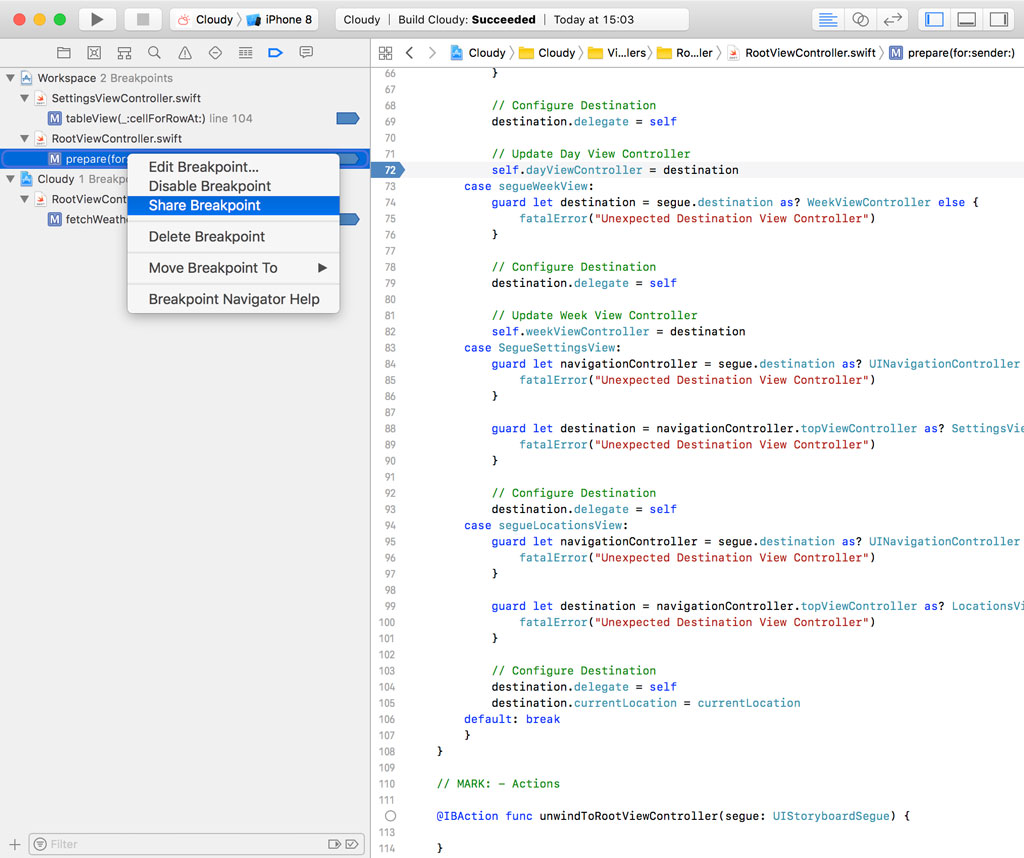
The Breakpoint Navigator displays shared breakpoints separately to make it clear that they're shared. It's similar to sharing a scheme.
Managing Breakpoints
Enabling/Disabling Breakpoints
There are several options to enable or disable a breakpoint or a collection of breakpoints. The most straightforward option is clicking the breakpoint in the gutter of the source editor. This technique also works in the Breakpoint Navigator on the left.
You can also enable or disable breakpoints by right-clicking the file, workspace, or project the breakpoint is defined in and choosing Enable Breakpoints or Disable Breakpoints from the menu.
Earlier in this series, I showed you how to disable every breakpoint of the project or workspace. When you run the application, the Debug Bar shows up at the bottom. In the Debug Bar, the second button from the left allows you to activate or deactivate every breakpoint defined in the project or workspace.
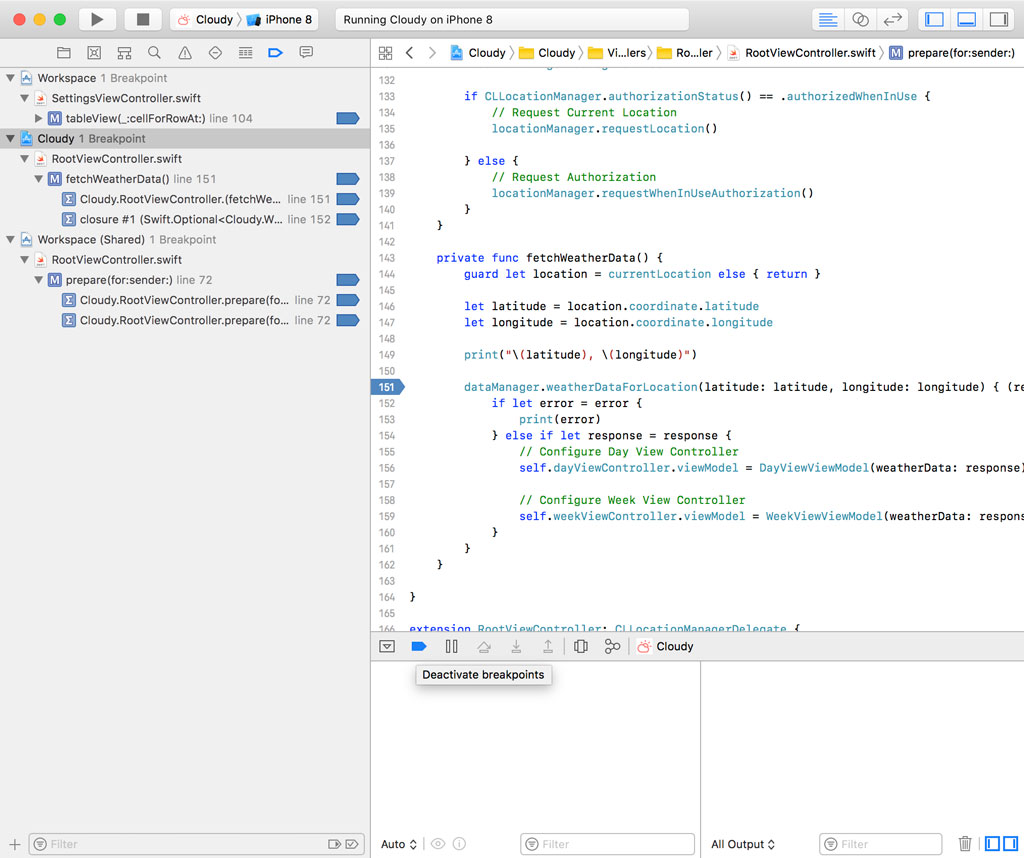
This is a very convenient shortcut if you're working with breakpoints.
Deleting Breakpoints
You can delete a breakpoint one of several ways. You can drag it from the gutter of the source editor until a small delete symbol appears.
This is the easiest solution most of the time. You can also right-click a breakpoint and choose Delete Breakpoint from the contextual menu.
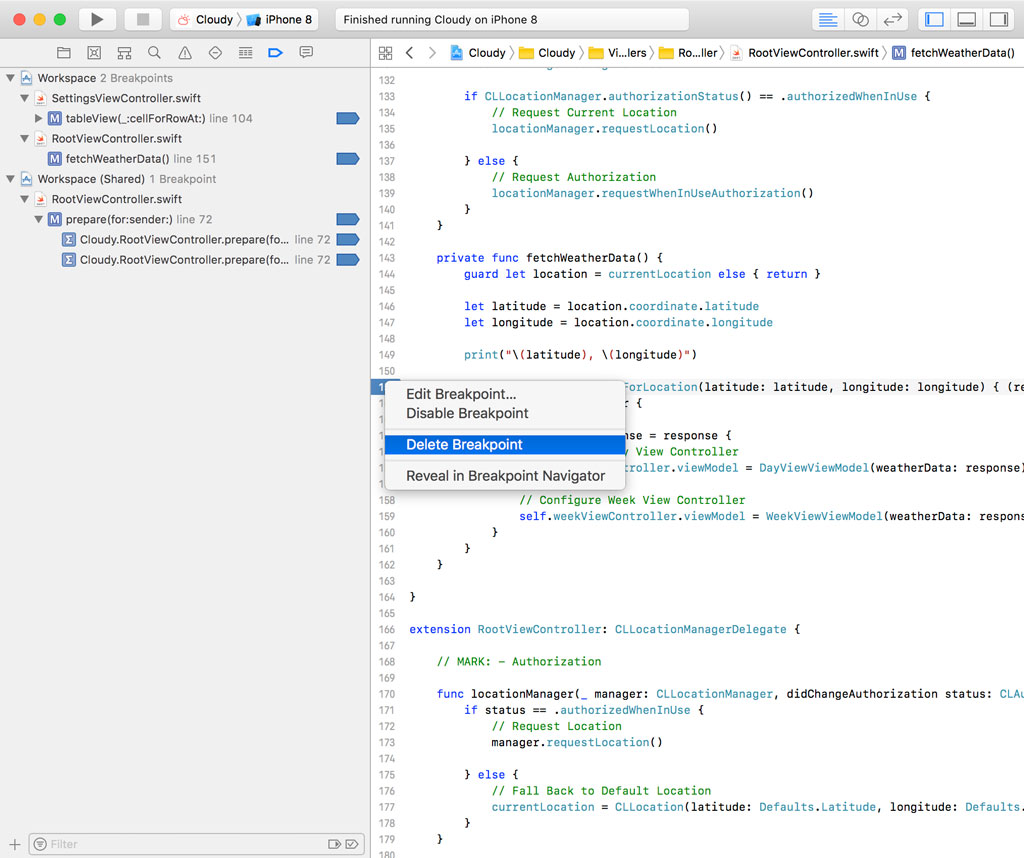
If you need to delete a number of breakpoints, then the Breakpoint Navigator gives you more flexibility. You can right-click a breakpoint, file, or scope to delete one or more breakpoints.
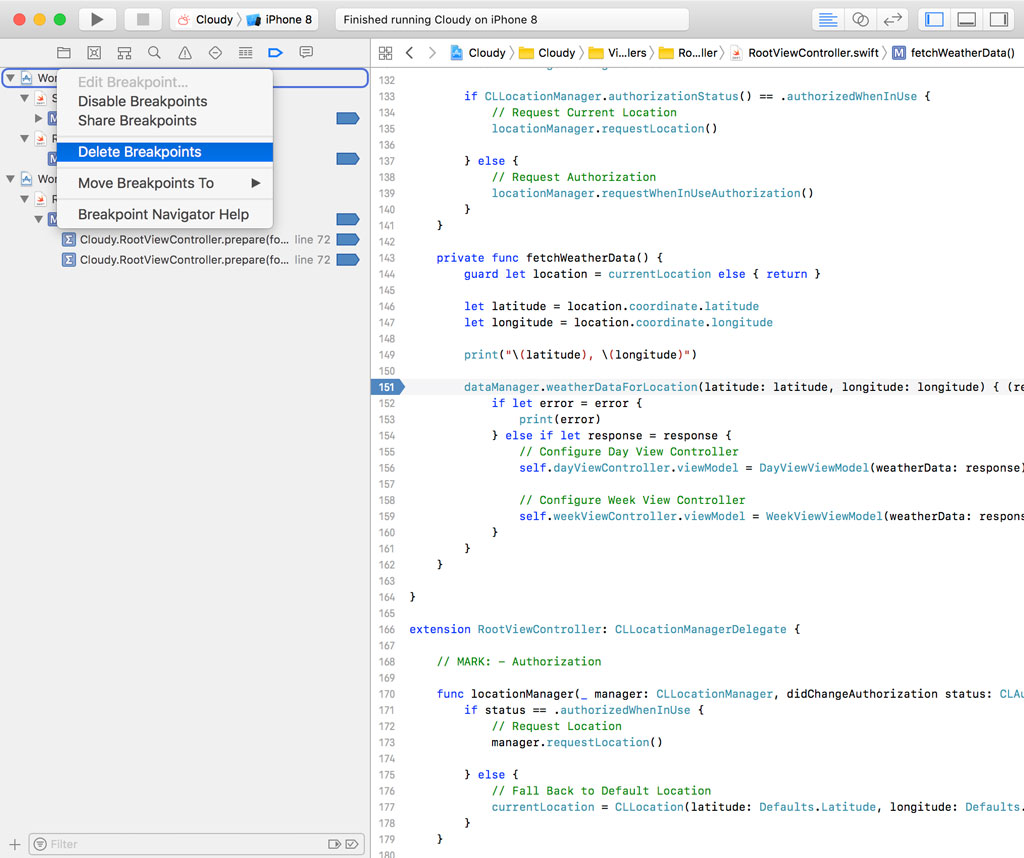
This is useful if you want to clean up the workspace or project you're working in once you've finished debugging.
Editing Breakpoints
The ability to edit a breakpoint is a feature that's often overlooked by developers. To edit a breakpoint, right-click the breakpoint in the Breakpoint Navigator or in the gutter of the source editor and choose Edit Breakpoint. This brings up a pop-up window with several options.
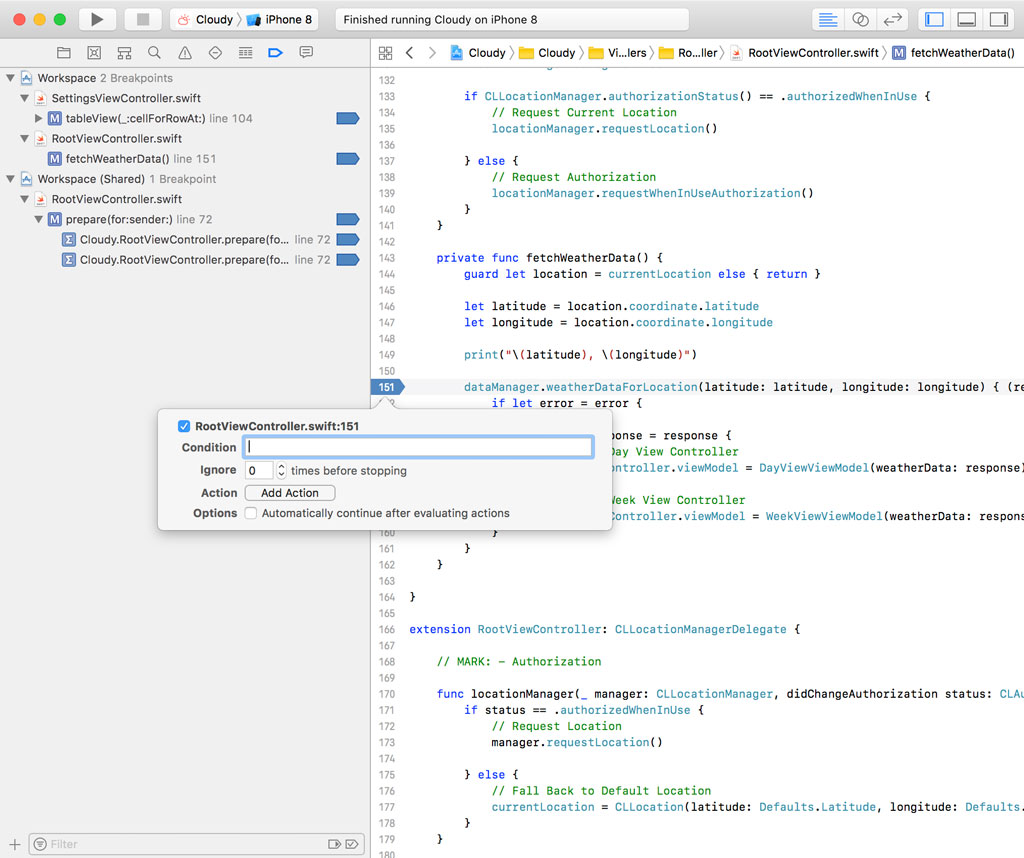
Breakpoint Conditions
By default, the debugger pauses the execution of the application when it hits a breakpoint. Some breakpoints, however, are hit very often and you don't want to interrupt the application every time the breakpoint is hit. That's where conditions come into play.
A breakpoint can have a condition that defines when the breakpoint should result in the interruption of the application. Let me show you how this works.
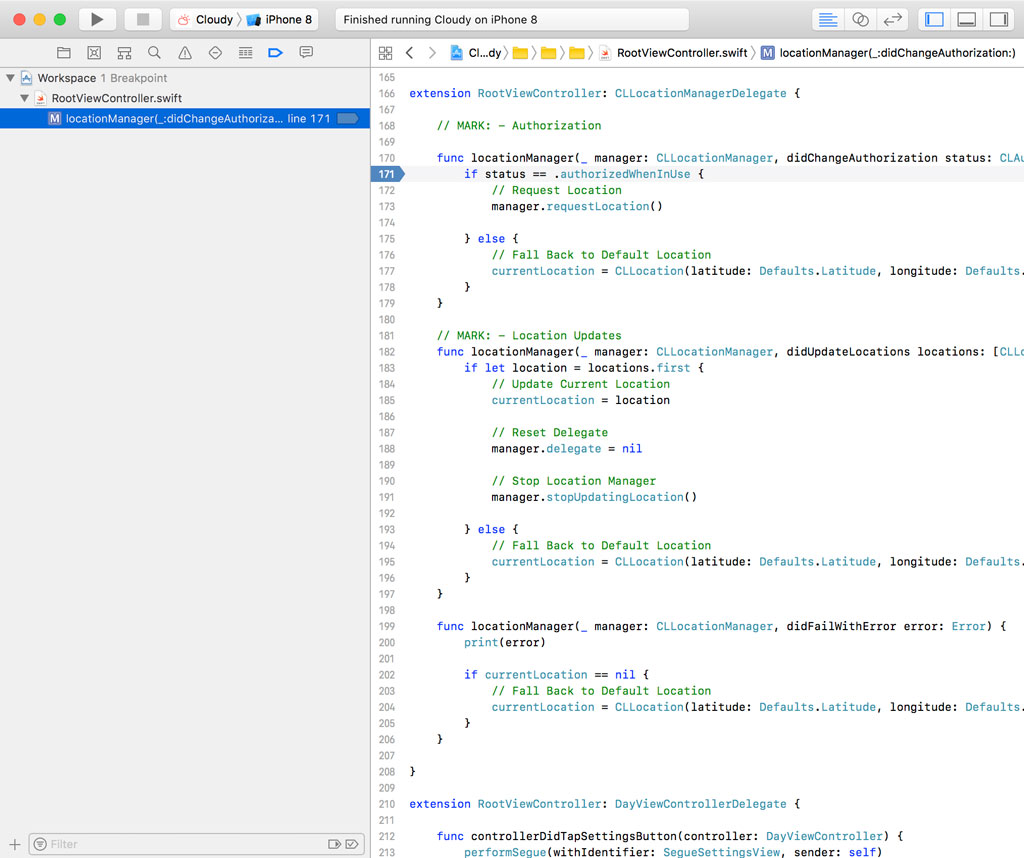
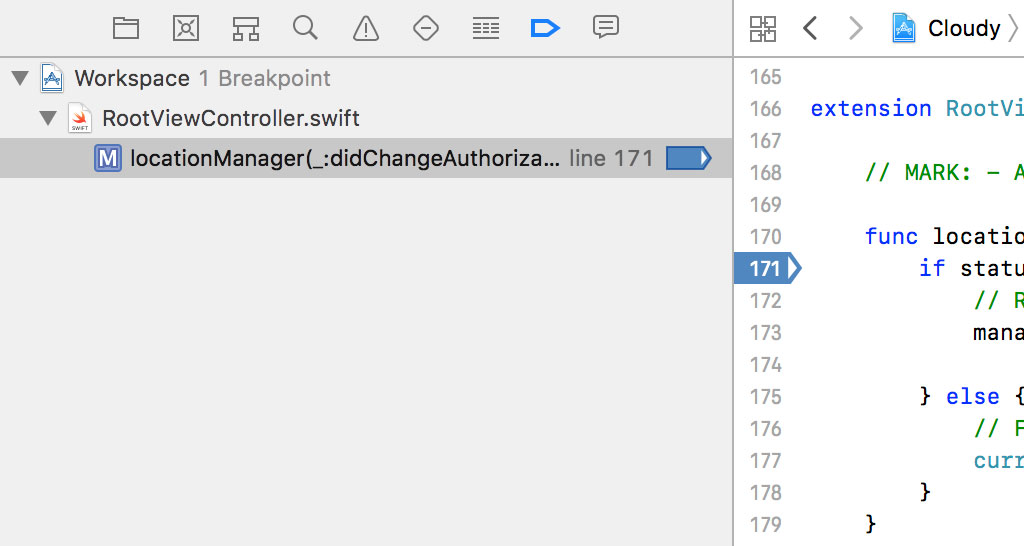
Delete the breakpoints we set earlier to start with a clean slate. Open RootViewController.swift and set a breakpoint on line 171 in the locationManager(_:didChangeAuthorization:) method of the CLLocationManagerDelegate protocol.
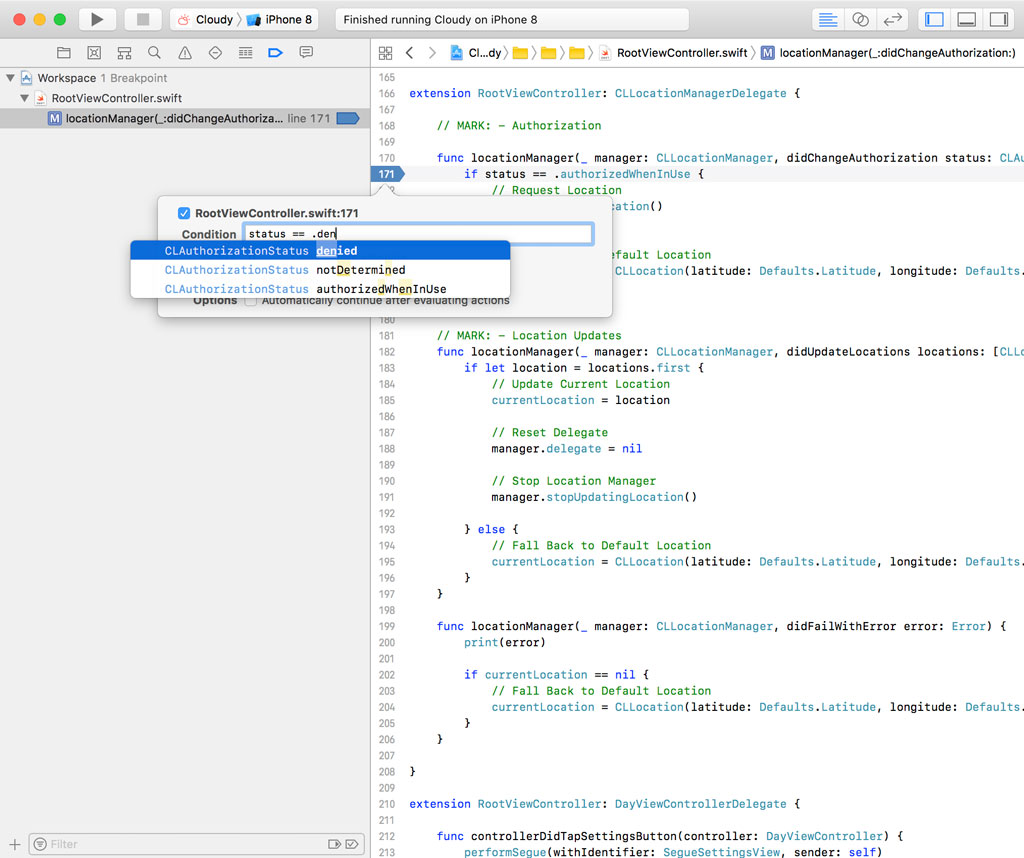
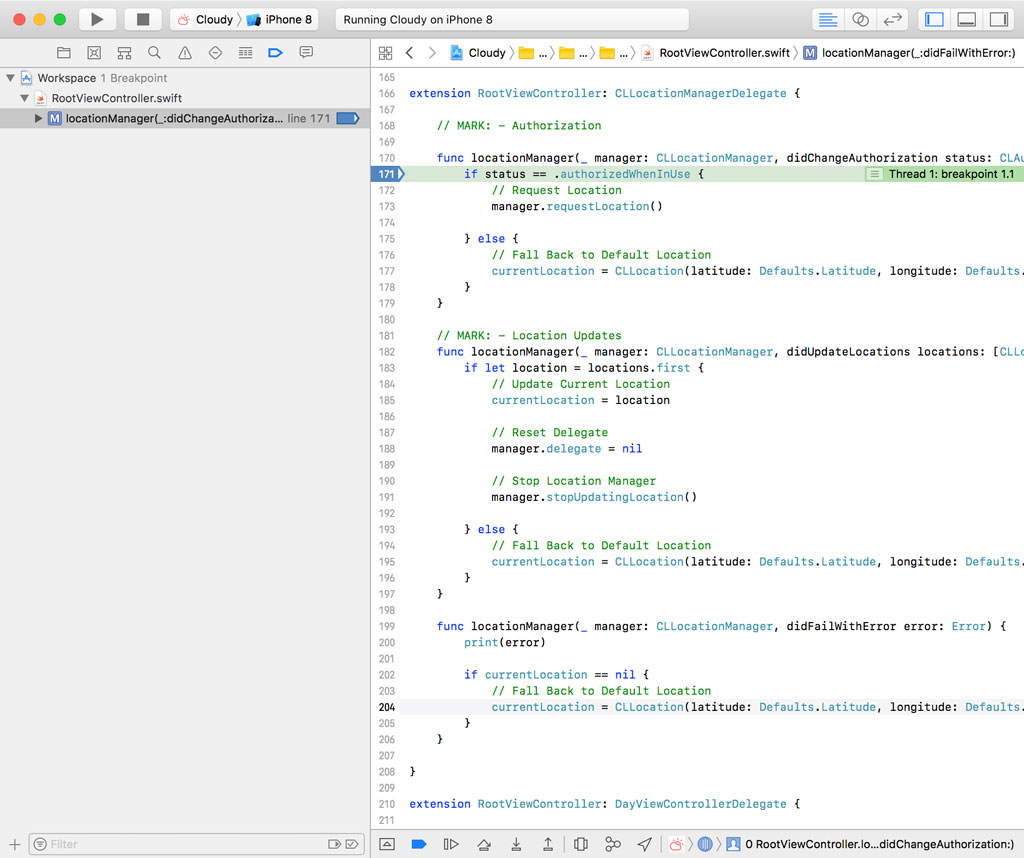
Let's assume we want to interrupt the application if the location manager notifies the application that the user has denied access to its current location. We could add an if statement to the locationManager(_:didChangeAuthorization:) method, but I don't want to change the implementation for debugging an issue. A better solution is to add a condition to the breakpoint.
When a breakpoint is hit, the debugger gives us access to the code that is in scope of the breakpoint's position. We can take advantage of this feature when we define a condition for the breakpoint.
If that sounds confusing, then take a look at this example. Right-click the breakpoint, choose Edit Breakpoint, and enter the following condition.
status == .denied
Notice that we can also take advantage of Xcode's autocompletion.
A white triangle appears on the right of the breakpoint to indicate the breakpoint has been edited.
Let's see if this works. Run the application. The breakpoint should not be hit if the user grants access to their current location.
If we remove the application, run the application again, and deny access, the breakpoint should be hit.
Ignoring Breakpoints
Xcode also offers the option to ignore a breakpoint until it's been hit a set number of times. The Ignore option gives us this ability. It isn't an option I use frequently, but it has several useful applications.
You could, for example, add a breakpoint to a section of code that you don't expect to be hit multiple times. The breakpoint acts as a warning signal in that scenario.
Let's see how we can apply this in Cloudy. The Core Location framework should be used sparingly because location services can drain the battery of the device quickly. We only want to ask the Core Location framework for the user's location once. Let's add a breakpoint to the locationManager(_:didUpdateLocations:) method of the CLLocationManagerDelegate protocol.
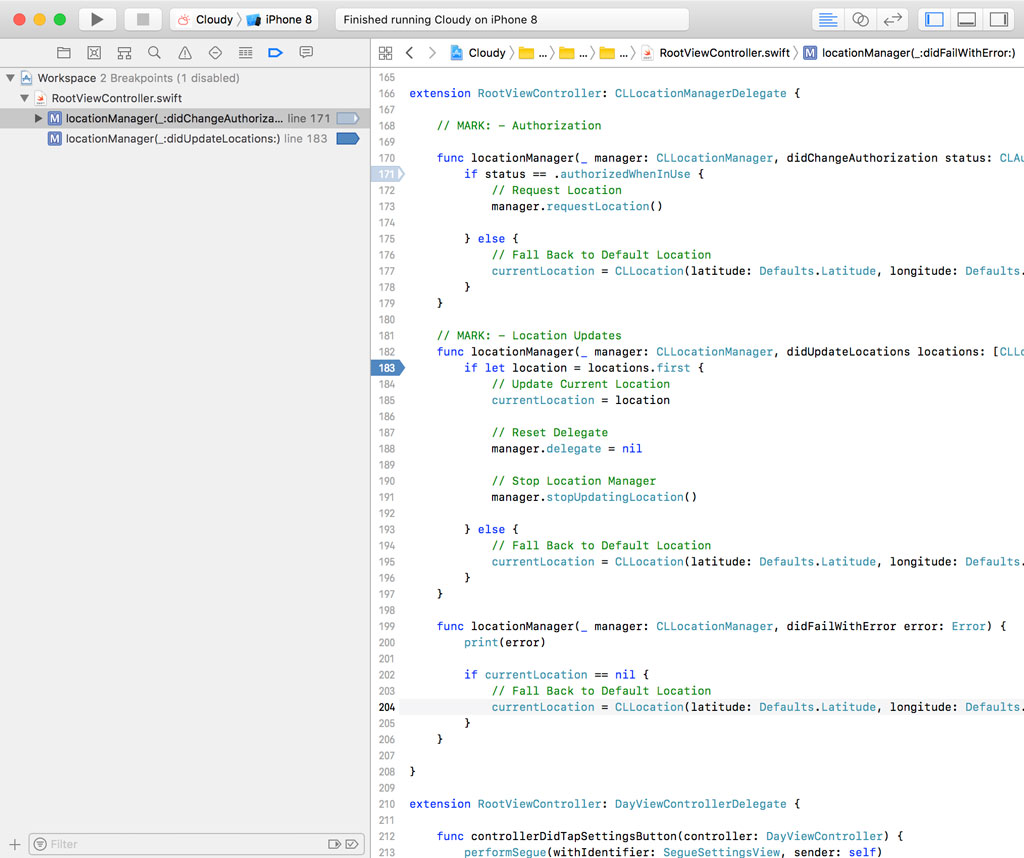
We know that the application asks for the user's location on launch and that should be the only time it requests the user's location. As a precaution, we add a breakpoint to the locationManager(_:didUpdateLocations:) method and instruct the debugger to ignore the first hit by setting Ignore to 1.

The breakpoint should not be hit if we run the application. Push the application to the background and bring it back into focus. The breakpoint is hit, which means the application is requesting the user's location more than once.
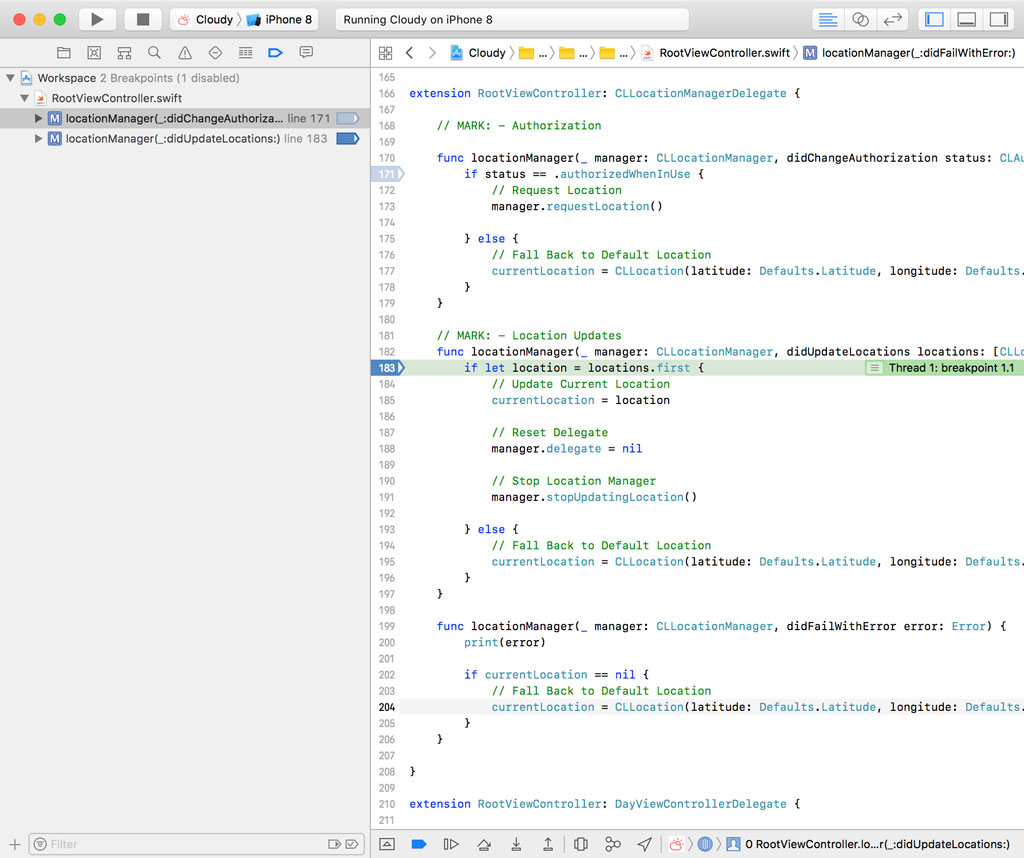
We can inspect the stack track in the Debug Navigator to figure out what's causing this behavior, but we're not in luck this time. The Core Location framework does most of its work asynchronously in the background and the locationManager(_:didUpdateLocations:) method is invoked when the location manager has data to share.

The method or function that triggered the request for the user's location is no longer present in the application's stack trace. This highlights the challenges you face when you're debugging asynchronous operations.
If we retrace our steps, however, we can figure out that the application asks for the user's location every time the application becomes active. That explains why the breakpoint was hit twice.
Breakpoint Actions
You can also assign one or more actions to a breakpoint. The actions are executed when the breakpoint is hit. Xcode gives you the ability to capture a GPU frame, log a message to the console, or execute an AppleScript script, a shell command, or a debugger command. You can even ask Xcode to play a sound when a breakpoint is hit.
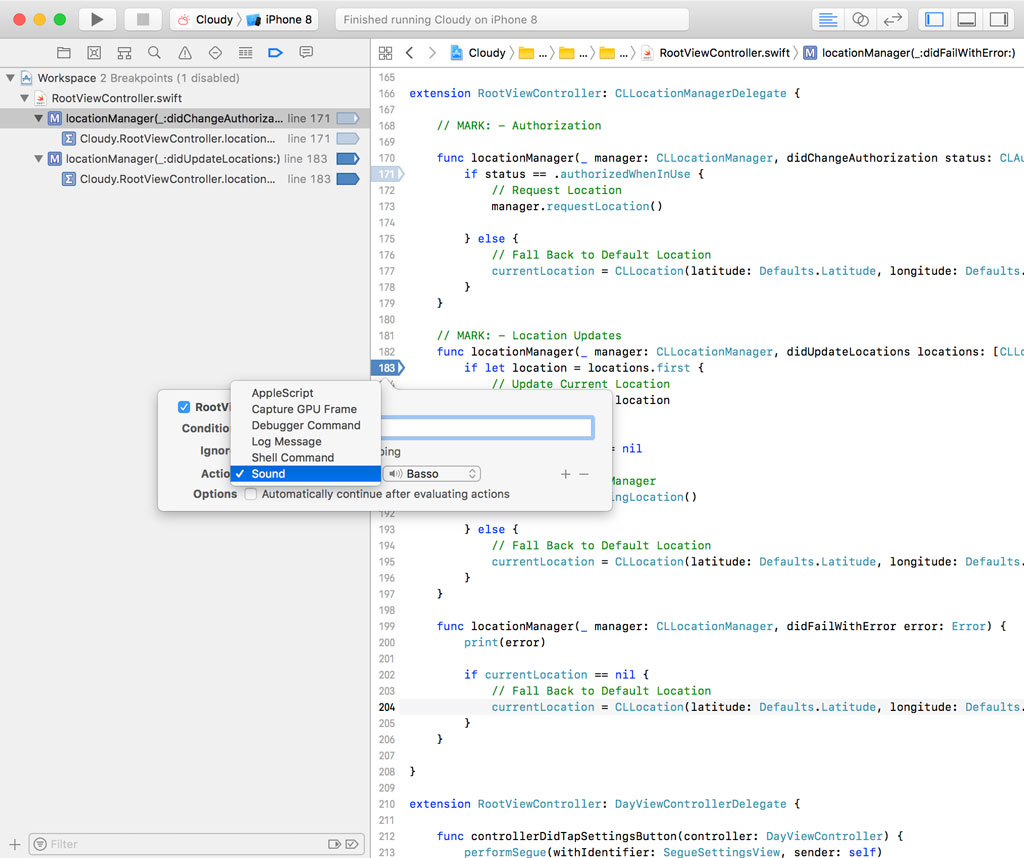
Playing a sound may seem like a gimmick, but I can assure you that it's incredibly useful at times. I find it most useful in combination with the last option Xcode offers us, the checkbox labeled Automatically continue after evaluating actions.

When I'm debugging a complex issue and have dozens of breakpoints set, I don't want to step through every breakpoint. It often suffices to know that a particular piece of code is executed and sound can be more efficient than a message in Xcode's console.
By checking the checkbox at the bottom, Xcode doesn't interrupt the application. It plays the sound and continues execution. It's important to keep in mind that breakpoints have an impact on performance. This isn't a problem in development, but remember that performance issues in development could be caused by breakpoints and their associated actions.
Because we can execute arbitrary scripts when a breakpoint is hit, we can perform almost any action we want to help us debug an issue.
What's Next
Up until now, we have focused on file and line breakpoints. File and line breakpoints are very useful, but they are sometimes not what you need. In the next episode on breakpoints, we zoom in on the other breakpoint types we briefly discussed earlier in this series.