The memory graph debugger built into Xcode is a very welcome addition for debugging memory issues. In the previous episode, we resolved a memory issue we discovered somewhat by accident. While it can be useful to use the memory graph debugger to investigate complex object graphs, it would be convenient if Xcode warns us about possible memory issues. And that's exactly what the memory graph debugger does.
Strong Reference Cycles
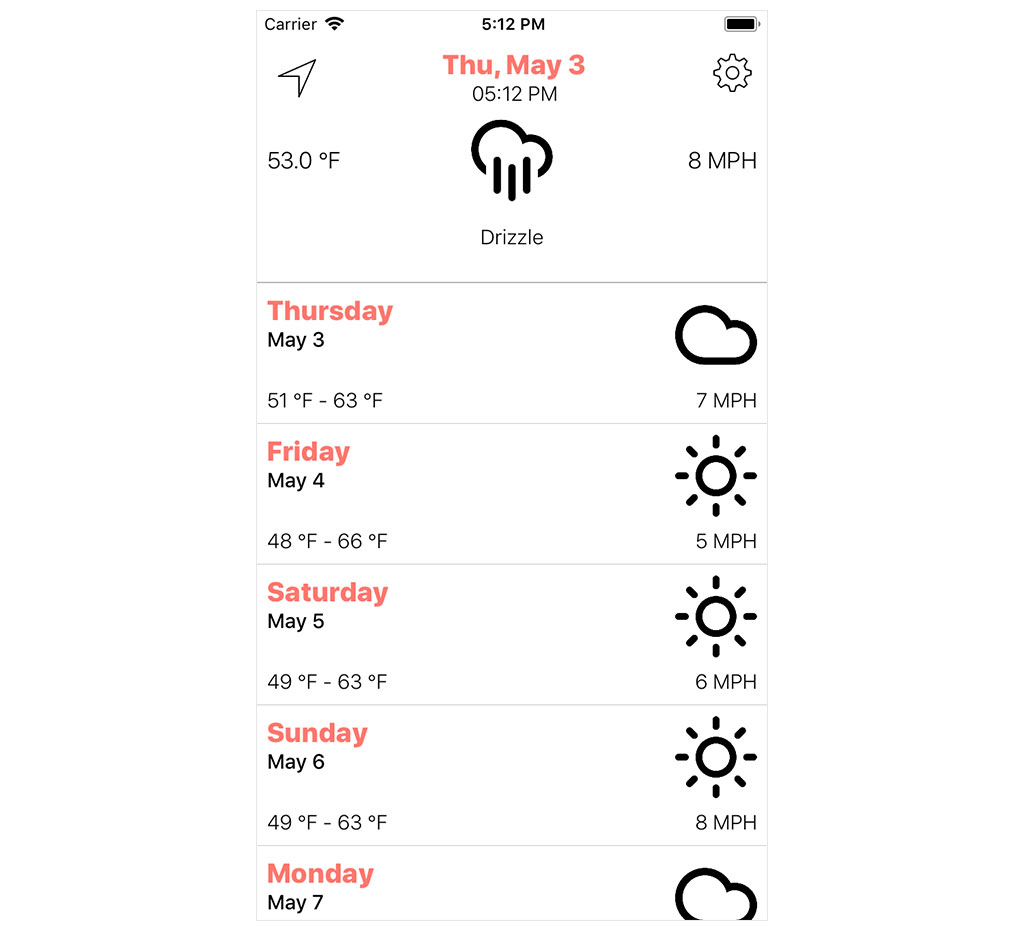
To illustrate how the memory graph debugger can help find memory issues, we revisit Cloudy. Download the starter project of this episode if you'd like to follow along.
Cloudy takes advantage of the delegation pattern in several classes. Even though the delegation pattern is a proven pattern that's easy to implement, it feels a bit dated from time to time. Closures are a modern alternative and feel in many ways more intuitive.
Open SettingsViewController.swift. I removed the SettingsViewControllerDelegate protocol and replaced it with a collection of properties. Each property is of an optional type and references a closure. Remember that closures are reference types, not value types.
import UIKit

final class SettingsViewController: UIViewController {

    // MARK: - Properties

    @IBOutlet var tableView: UITableView!

    // MARK: -

    var controllerDidChangeTimeNotation: (() -> Void)?
    var controllerDidChangeUnitsNotation: (() -> Void)?
    var controllerDidChangeTemperatureNotation: (() -> Void)?

    ...

}
When the user modifies a preference, the settings view controller invokes the closure that corresponds with the setting the user changed. Optional chaining makes the syntax elegant and concise.
// MARK: - Table View Delegate Methods

func tableView(_ tableView: UITableView, didSelectRowAt indexPath: IndexPath) {
    tableView.deselectRow(at: indexPath, animated: true)

    guard let section = Section(rawValue: indexPath.section) else { fatalError("Unexpected Section") }

    switch section {
    case .time:
        let timeNotation = UserDefaults.timeNotation()
        guard indexPath.row != timeNotation.rawValue else { return }

        if let newTimeNotation = TimeNotation(rawValue: indexPath.row) {
            // Update User Defaults
            UserDefaults.setTimeNotation(timeNotation: newTimeNotation)

            // Invoke Handler
            controllerDidChangeTimeNotation?()
        }
    case .units:
        let unitsNotation = UserDefaults.unitsNotation()
        guard indexPath.row != unitsNotation.rawValue else { return }

        if let newUnitsNotation = UnitsNotation(rawValue: indexPath.row) {
            // Update User Defaults
            UserDefaults.setUnitsNotation(unitsNotation: newUnitsNotation)

            // Invoke Handler
            controllerDidChangeUnitsNotation?()
        }
    case .temperature:
        let temperatureNotation = UserDefaults.temperatureNotation()
        guard indexPath.row != temperatureNotation.rawValue else { return }

        if let newTemperatureNotation = TemperatureNotation(rawValue: indexPath.row) {
            // Update User Defaults
            UserDefaults.setTemperatureNotation(temperatureNotation: newTemperatureNotation)

            // Invoke Handler
            controllerDidChangeTemperatureNotation?()
        }
    }

    tableView.reloadSections(IndexSet(integer: indexPath.section), with: .none)
}
The RootViewController class also underwent some changes and takes advantage of the new API of the SettingsViewController class. In the prepare(for:sender:) method of the RootViewController class, we configure the SettingsViewController instance. The idea is simple. If the user modifies a setting, we update the weather view controllers and dismiss the settings view controller.
// MARK: - Navigation

override func prepare(for segue: UIStoryboardSegue, sender: Any?) {
    guard let identifier = segue.identifier else { return }

    switch identifier {
    case segueDayView:
        ...
    case segueWeekView:
        ...
    case SegueSettingsView:
        guard let navigationController = segue.destination as? UINavigationController else {
            fatalError("Unexpected Destination View Controller")
        }

        guard let destination = navigationController.topViewController as? SettingsViewController else {
            fatalError("Unexpected Destination View Controller")
        }

        // Configure Destination
        destination.controllerDidChangeTimeNotation = {
            self.dayViewController.reloadData()
            self.weekViewController.reloadData()

            destination.dismiss(animated: true)
        }

        destination.controllerDidChangeUnitsNotation = {
            self.dayViewController.reloadData()
            self.weekViewController.reloadData()

            destination.dismiss(animated: true)
        }

        destination.controllerDidChangeTemperatureNotation = {
            self.dayViewController.reloadData()
            self.weekViewController.reloadData()

            destination.dismiss(animated: true)
        }
    case segueLocationsView:
        ...
    default: break
    }
}
You may already see a few problems with this implementation. Before you draw any conclusions, though, I'd like to show you how the memory graph debugger can help us find memory issues. Run the application in the simulator and toggle each of the settings in the application's settings view.
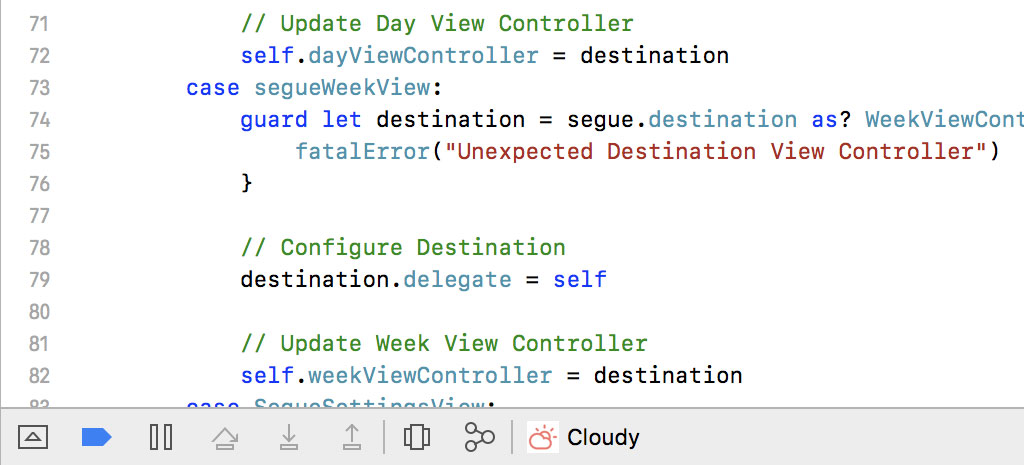
The application seems to work fine. Nothing has changed from the perspective of the user. Let's take a look under the hood by clicking the Debug Memory Graph button in the debug bar at the bottom.
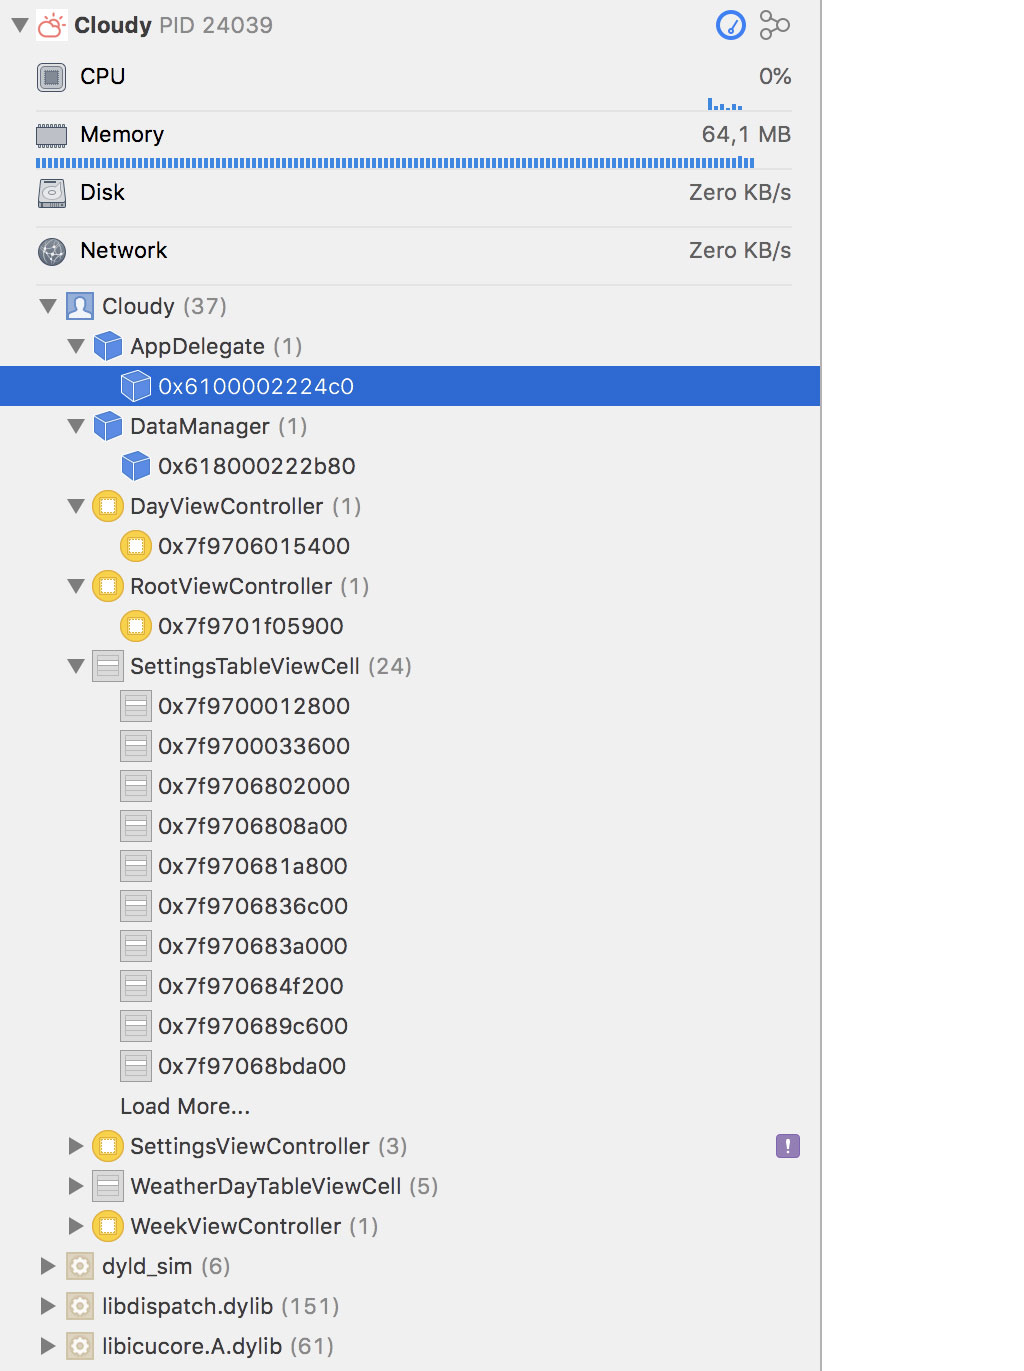
The Debug Navigator on the left shows us the objects that are currently alive on the heap. That should look familiar if you've watched the previous episode. What's new are the purple exclamation marks in the Debug Navigator. Some of the types are tagged with a purple exclamation mark. Each exclamation mark represents a runtime issue.
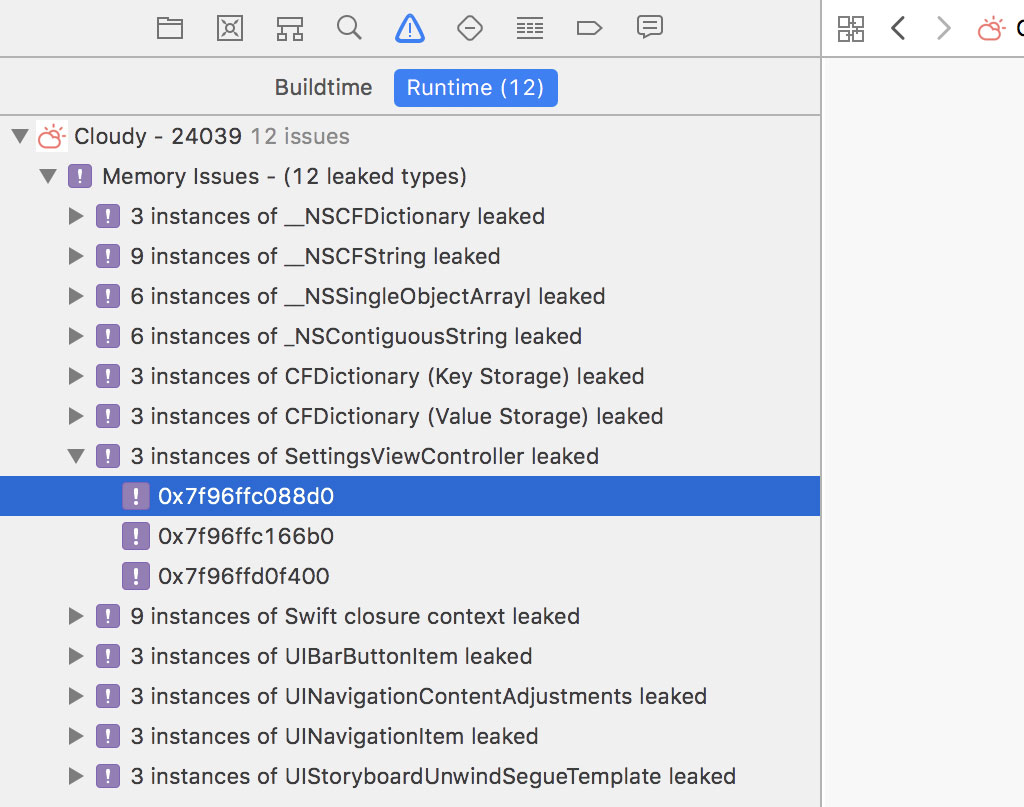
Open the Issue Navigator on the left and select the Runtime tab at the top to list the runtime issues the debugger has generated.
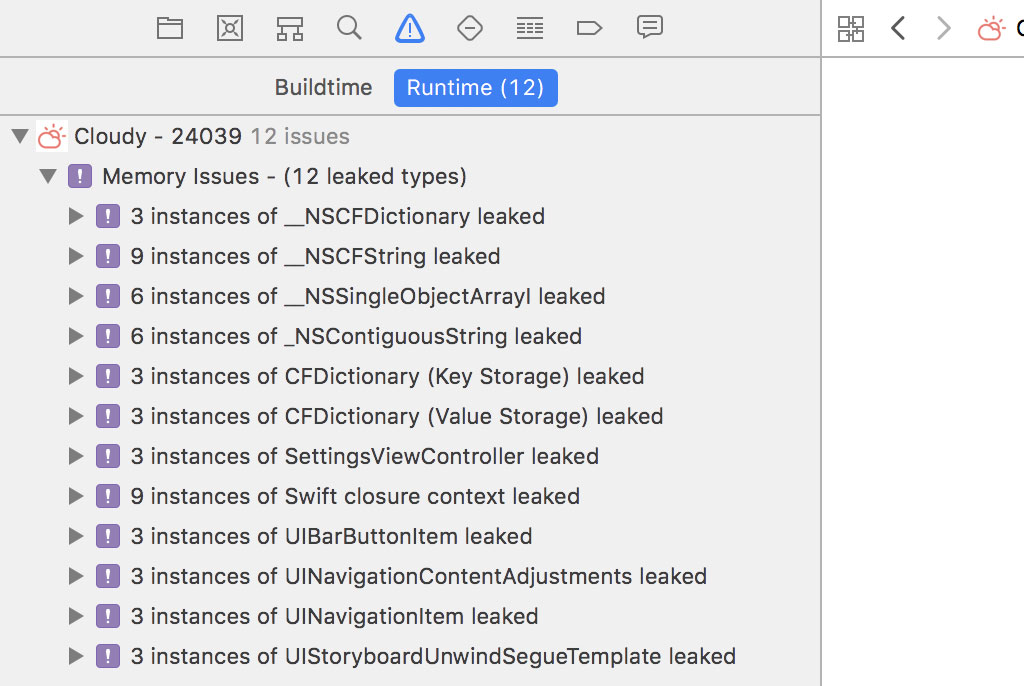
The debugger warns us that the application may be leaking objects. I say may be because it is possible that the list contains false positives. Let's look through the list to find out what the problem is.
There's one type that stands out because it's defined in the Cloudy module, the SettingsViewController class. The debugger reports that three instances of the SettingsViewController class are being leaked. Expand the list of issues for the SettingsViewController class and click the first runtime issue.
This time the memory graph debugger doesn't show us a root analysis graph. It shows us a reference cycle instead. The reference cycle visualizes why the SettingsViewController instance we selected in the Issue Navigator is still alive.
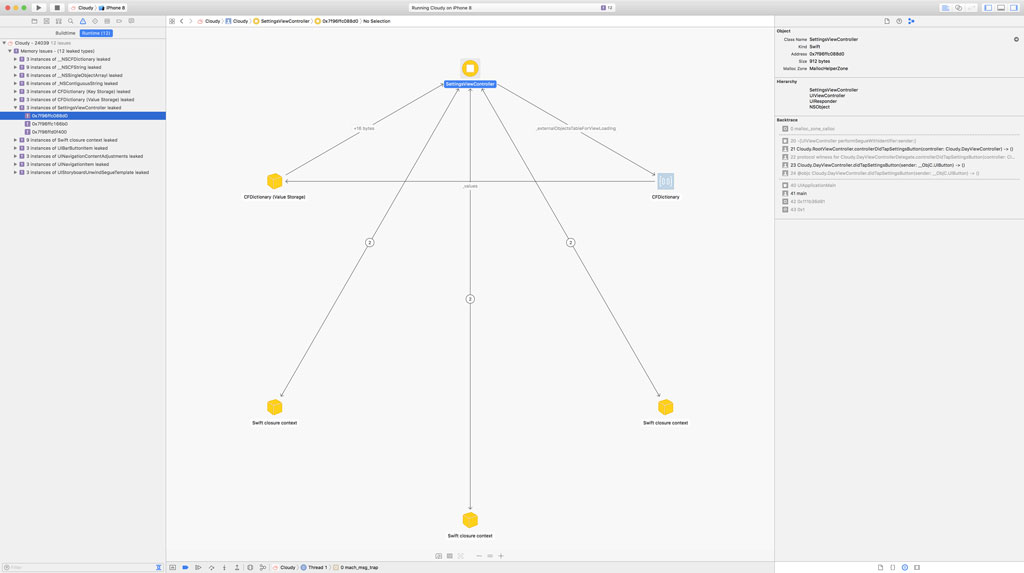
Notice that the connections that connect the SettingsViewController instance with the closures have arrows pointing in both directions. The arrows indicate that the SettingsViewController instance references each of the closures and each closure keeps a reference to the SettingsViewController instance.
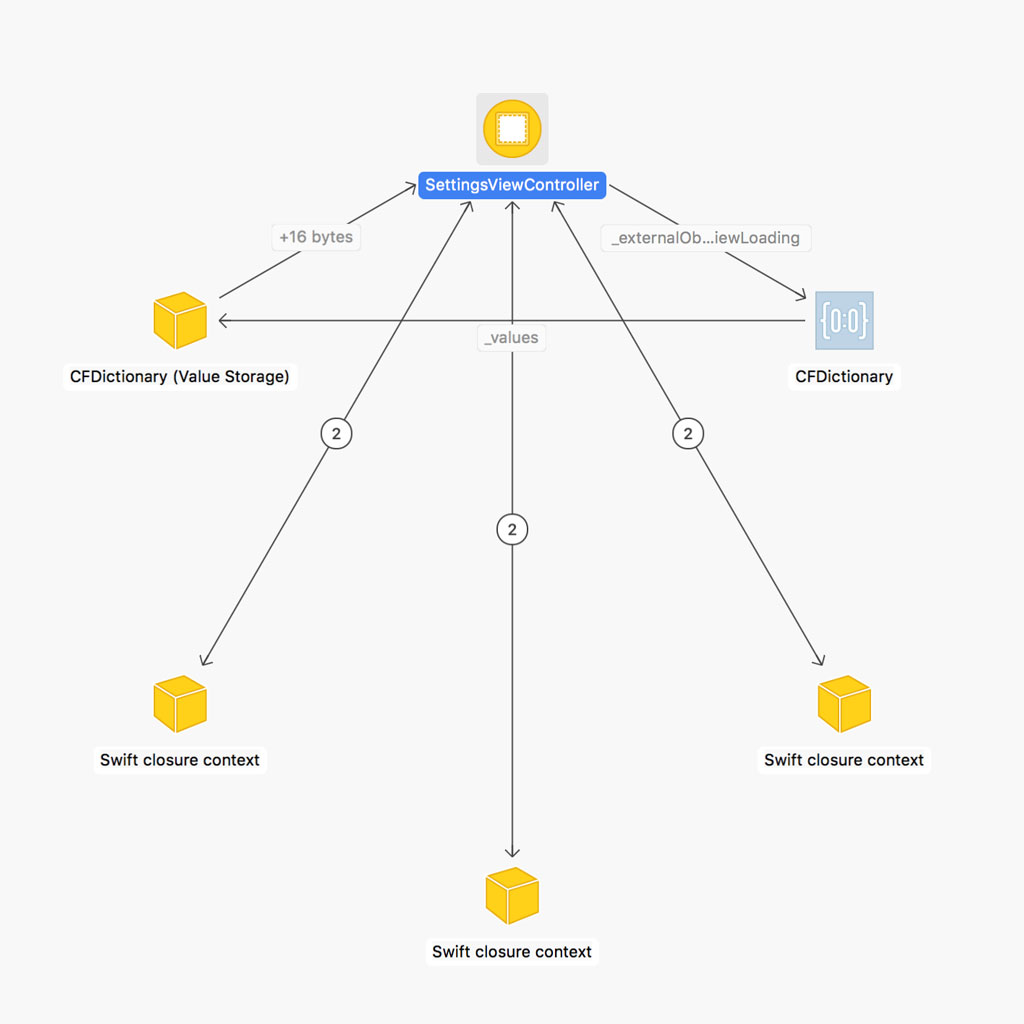
If we click the numbered badge of one of the connections, we can see that a reference to the closure is stored in one of the properties of the SettingsViewController instance.
Select the SettingsViewController instance and open the Memory Inspector on the right. The allocation history of the SettingsViewController instance shows us how the object came into existence. That isn't surprising.
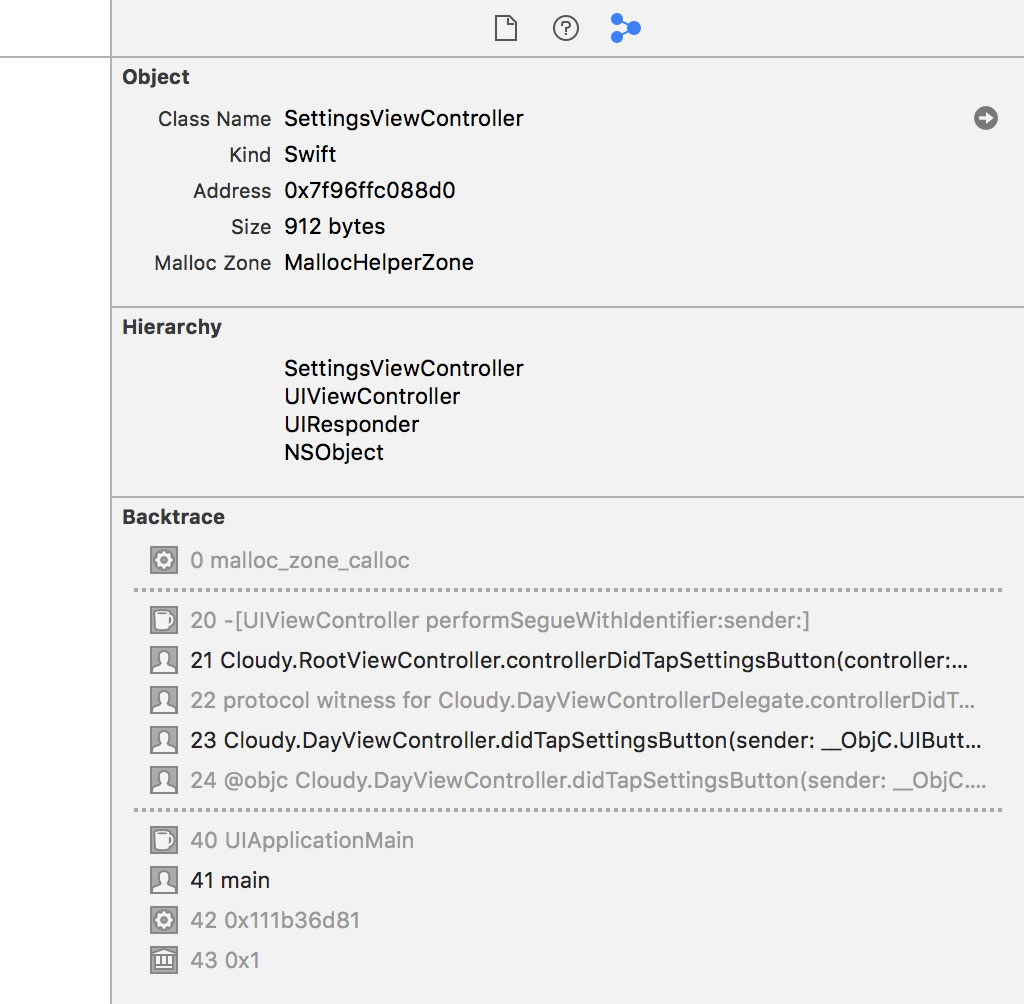
Select one of the closures that reference the SettingsViewController instance and take a look at the Memory Inspector. That's more interesting. The allocation history of the closure reveals when the closure was instantiated. It may give us a clue where the reference cycle originated.
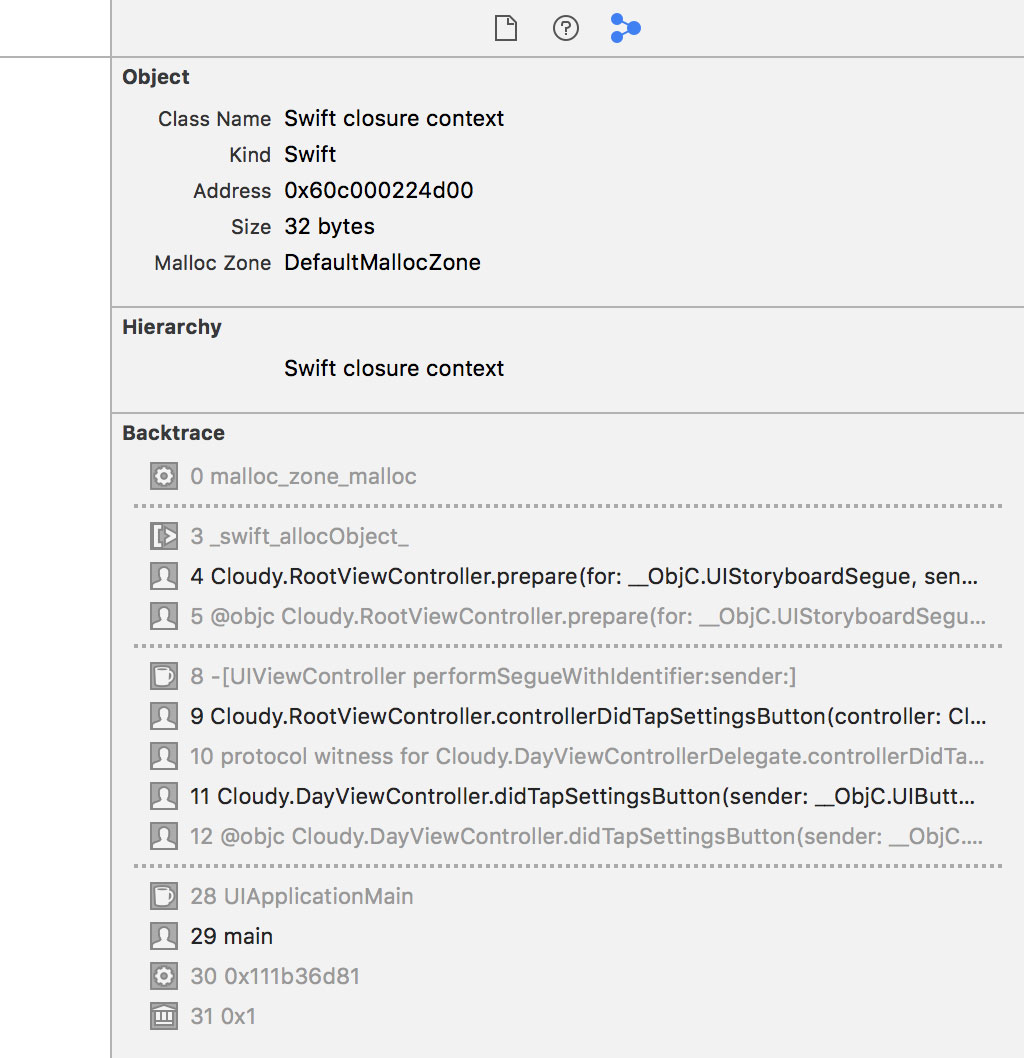
The backtrace indicates that the closure was instantiated in the prepare(for:sender:) method of the RootViewController class. Hover over the stack frame in the Memory Inspector and click the small arrow on the right to navigate to the implementation of the prepare(for:sender:) method of the RootViewController class.
// MARK: - Navigation

override func prepare(for segue: UIStoryboardSegue, sender: Any?) {
    guard let identifier = segue.identifier else { return }

    switch identifier {
    case segueDayView:
        ...
    case segueWeekView:
        ...
    case SegueSettingsView:
        guard let navigationController = segue.destination as? UINavigationController else {
            fatalError("Unexpected Destination View Controller")
        }

        guard let destination = navigationController.topViewController as? SettingsViewController else {
            fatalError("Unexpected Destination View Controller")
        }

        // Configure Destination
        destination.controllerDidChangeTimeNotation = {
            self.dayViewController.reloadData()
            self.weekViewController.reloadData()

            destination.dismiss(animated: true)
        }

        destination.controllerDidChangeUnitsNotation = {
            self.dayViewController.reloadData()
            self.weekViewController.reloadData()

            destination.dismiss(animated: true)
        }

        destination.controllerDidChangeTemperatureNotation = {
            self.dayViewController.reloadData()
            self.weekViewController.reloadData()

            destination.dismiss(animated: true)
        }
    case segueLocationsView:
        ...
    default: break
    }
}
There are a few problems. We strongly reference self, the RootViewController instance, in the closures we assign to the properties of the SettingsViewController instance. Even though this isn't causing the memory leaks, it's a better idea to weakly reference the RootViewController instance by using a capture list. I showed you how to do that in the previous episode.
// Configure Destination
destination.controllerDidChangeTimeNotation = { [weak self] in
    self?.dayViewController.reloadData()
    self?.weekViewController.reloadData()

    destination.dismiss(animated: true)
}

destination.controllerDidChangeUnitsNotation = { [weak self] in
    self?.dayViewController.reloadData()
    self?.weekViewController.reloadData()

    destination.dismiss(animated: true)
}

destination.controllerDidChangeTemperatureNotation = { [weak self] in
    self?.dayViewController.reloadData()
    self?.weekViewController.reloadData()

    destination.dismiss(animated: true)
}
The root cause of the memory leaks, however, are the strong references to the SettingsViewController instance. We assign a closure to each of the properties of the SettingsViewController instance. In the closure, we reference the SettingsViewController instance itself. That circular reference is causing the strong reference cycle. To break the reference cycle, we need to weakly reference the SettingsViewController instance in the closure.
// Configure Destination
destination.controllerDidChangeTimeNotation = { [weak self, weak destination] in
    self?.dayViewController.reloadData()
    self?.weekViewController.reloadData()

    destination?.dismiss(animated: true)
}

destination.controllerDidChangeUnitsNotation = { [weak self, weak destination] in
    self?.dayViewController.reloadData()
    self?.weekViewController.reloadData()

    destination?.dismiss(animated: true)
}

destination.controllerDidChangeTemperatureNotation = { [weak self, weak destination] in
    self?.dayViewController.reloadData()
    self?.weekViewController.reloadData()

    destination?.dismiss(animated: true)
}
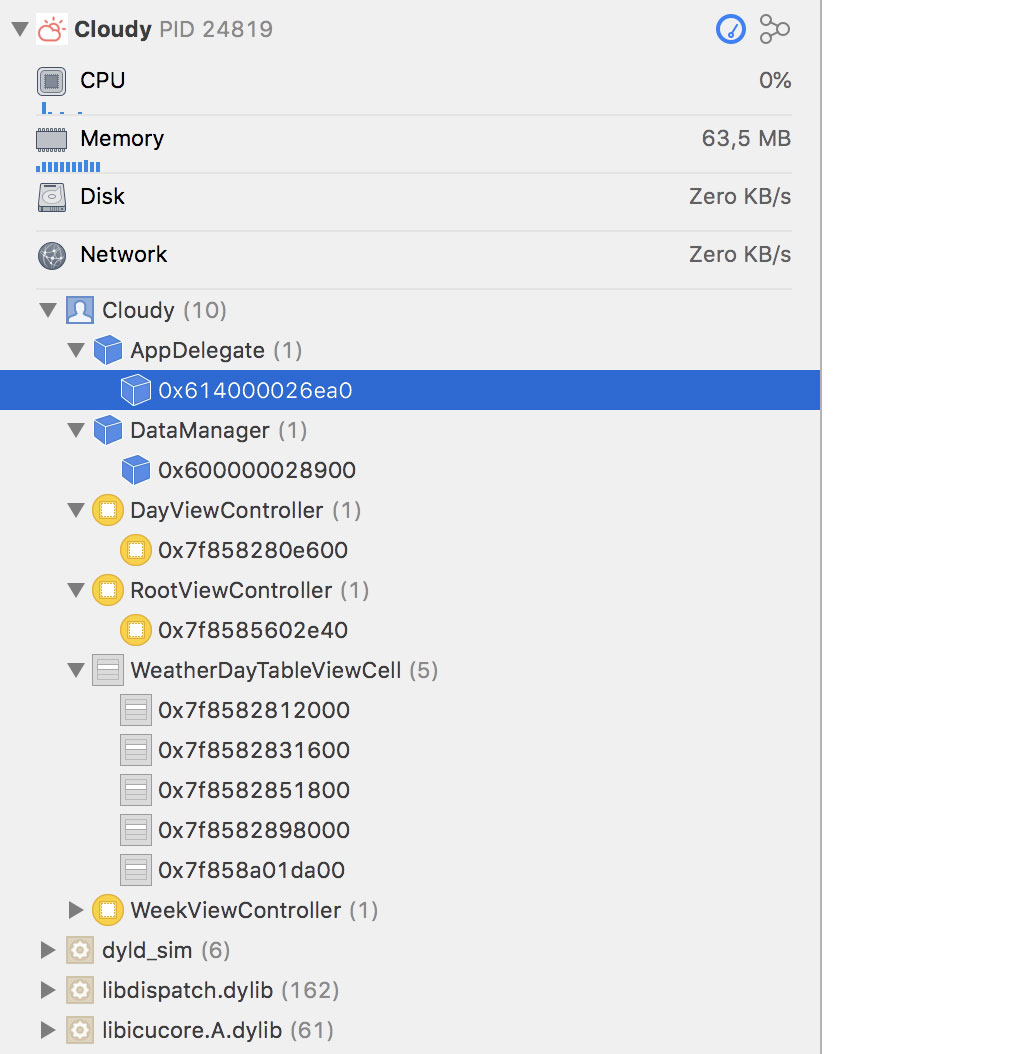
Let's find out if these changes resolved the memory issues the memory graph debugger discovered. Run the application in the simulator, modify each of the settings, and click the Debug Memory Graph button in the debug bar at the bottom.
The application works fine and, if we inspect the list of objects that are currently alive on the heap, we no longer see the leaked SettingsViewController instances. The simple changes we made in the prepare(for:sender:) method resolved the memory issues.
Subtle Memory Issues
Even though memory management isn't that difficult, you always need to be careful when you're working with reference types. I'd like to end this episode with an example that illustrates how a subtle change can have a big impact.
Cloudy offers the user the option to manage a list of favorite locations. Let me show you how that works. Run Cloudy in the simulator and click the arrow in the top left. This brings up the user's list of favorite locations.
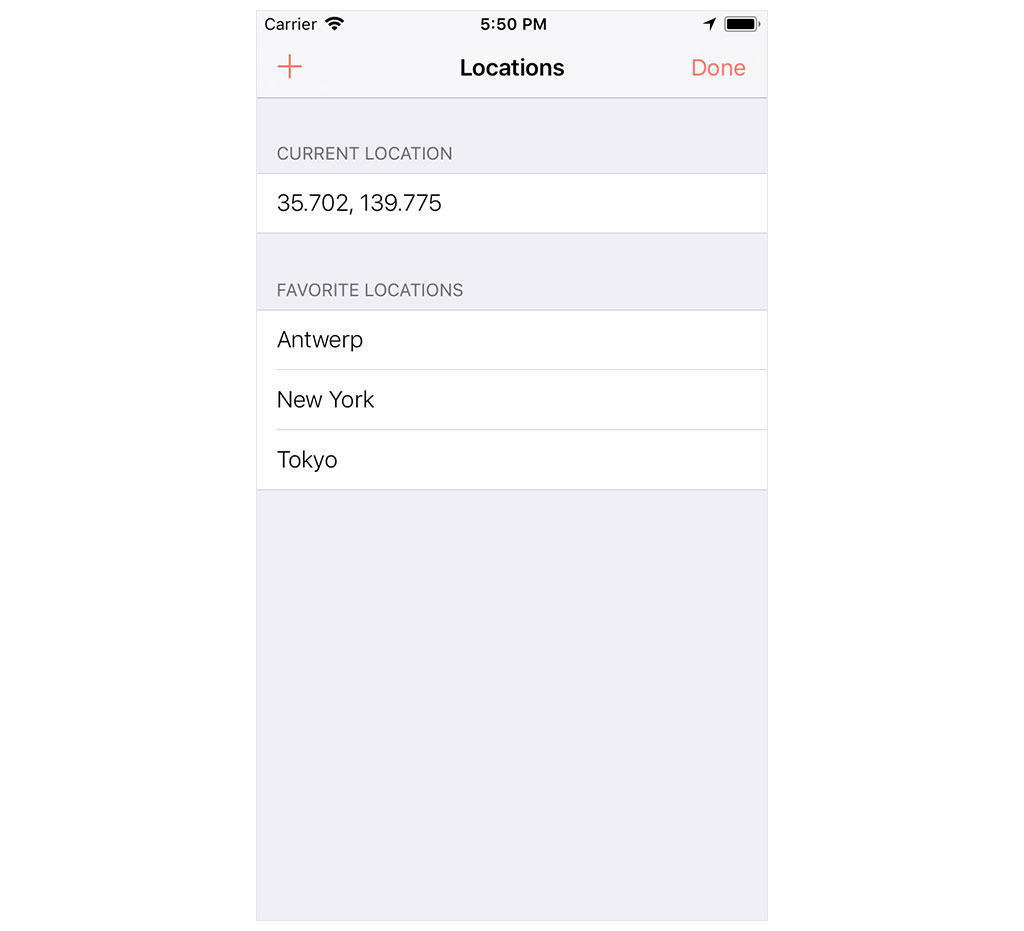
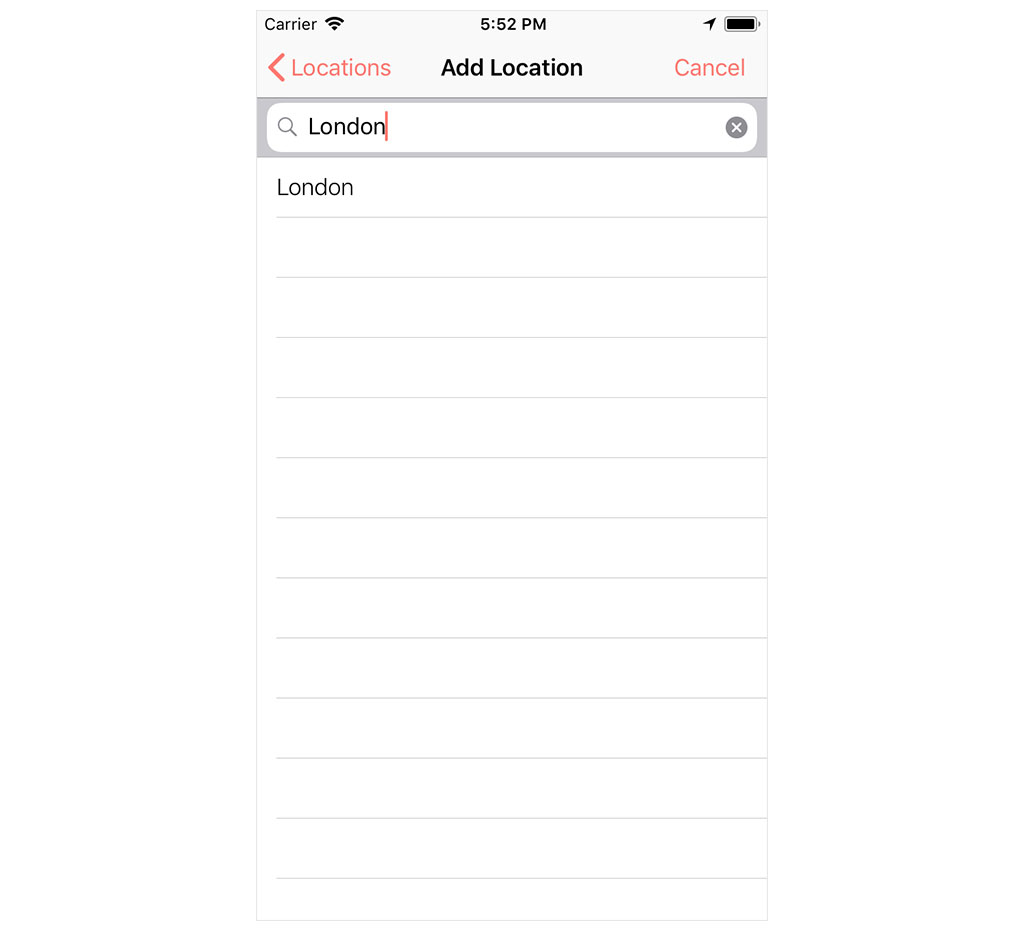
Click the + button in the top left, enter the name of a location, and select it from the list to mark it as a favorite location. Click the favorite location to fetch weather data for that location.
Pause the application by clicking the Debug Memory Graph button in the debug bar at the bottom. There are quite a few objects alive on the heap that are defined in the Cloudy module. Click the search bar at the bottom of the Debug Navigator and enter AddLocation to filter the objects listed in the Debug Navigator.
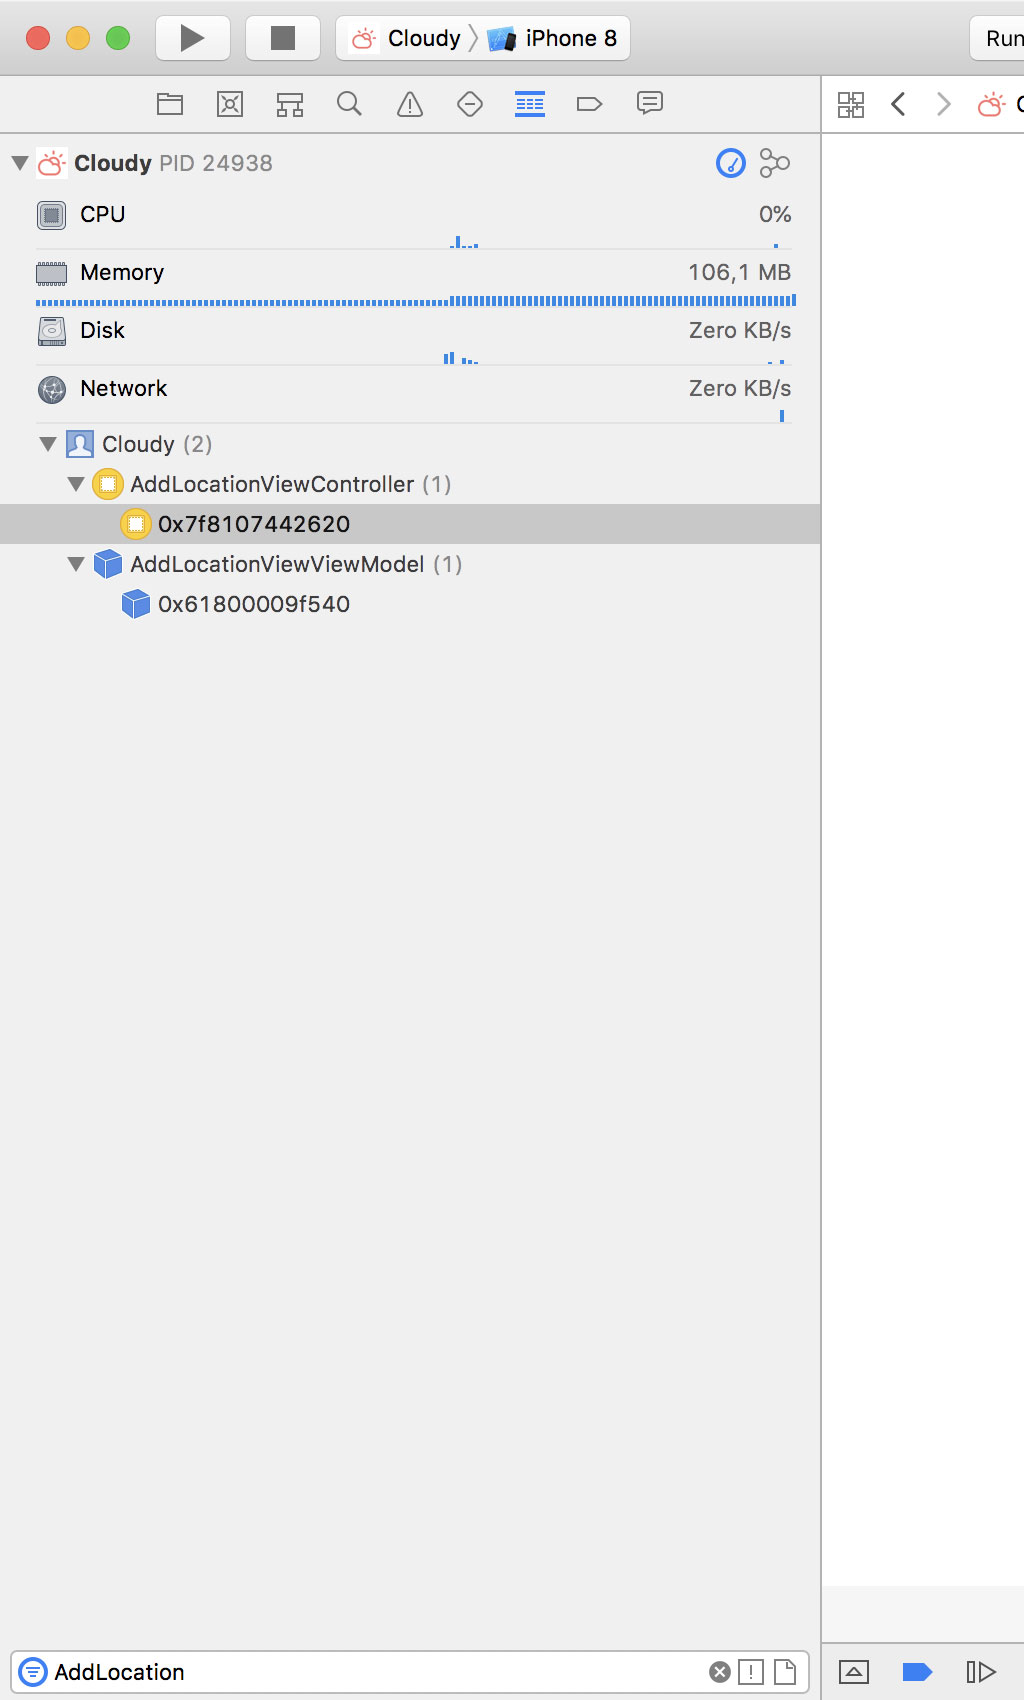
The AddLocationViewController class is in charge of adding new locations to the list of favorites. Even though we dismissed the AddLocationViewController instance a moment ago, it seems the object is still alive. The Debug Navigator also reveals that an instance of the AddLocationViewViewModel class is still alive on the heap. This is starting to smell, but the debugger doesn't show us any runtime issues this time.
As I mentioned at the start of this episode, the memory graph debugger isn't perfect. It misses some memory issues and it also reports false positives from time to time. Keep that in mind when you use the memory graph debugger to debug memory issues.
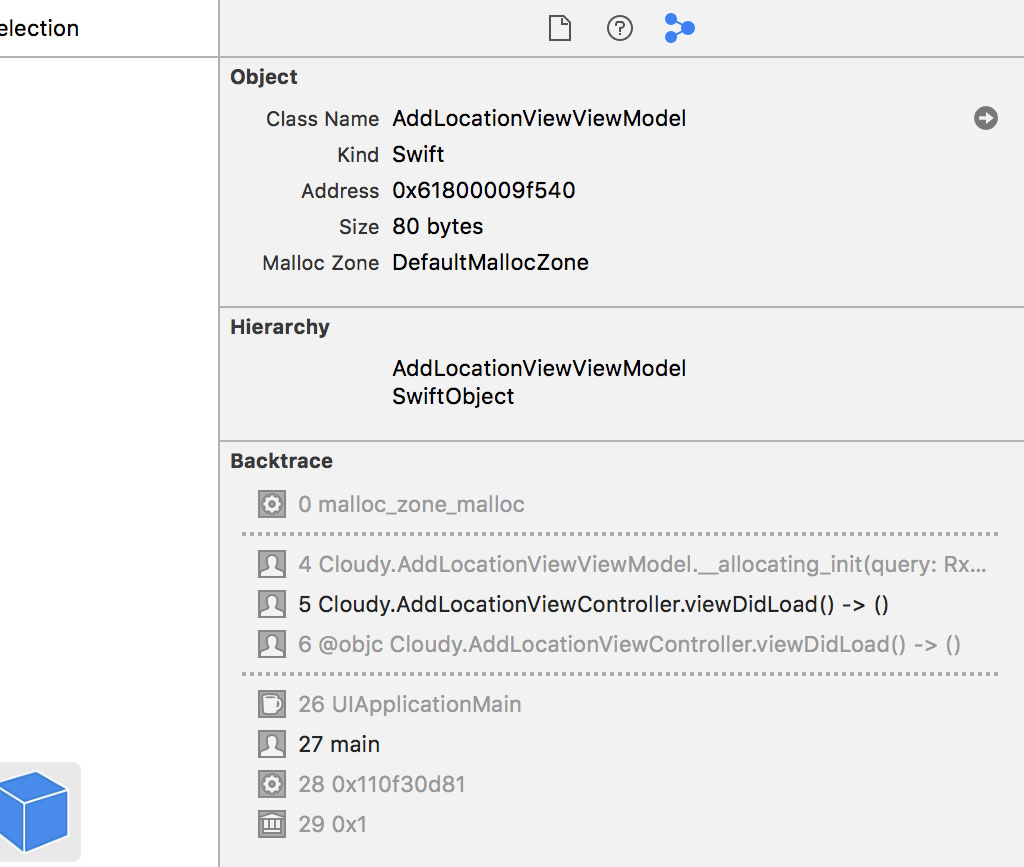
The allocation history of the AddLocationViewViewModel instance isn't helpful to debug the issue. It shows that the AddLocationViewViewModel instance was created in the viewDidLoad() method of the AddLocationViewController class.
Select the AddLocationViewController instance in the Debug Navigator. Its allocation history isn't helpful either, but the root analysis graph shows us a hint. Whenever I'm investigating a memory issue and the root analysis graph contains a closure, a warning bell goes off in my head. Select the closure that references the AddLocationViewController instance.
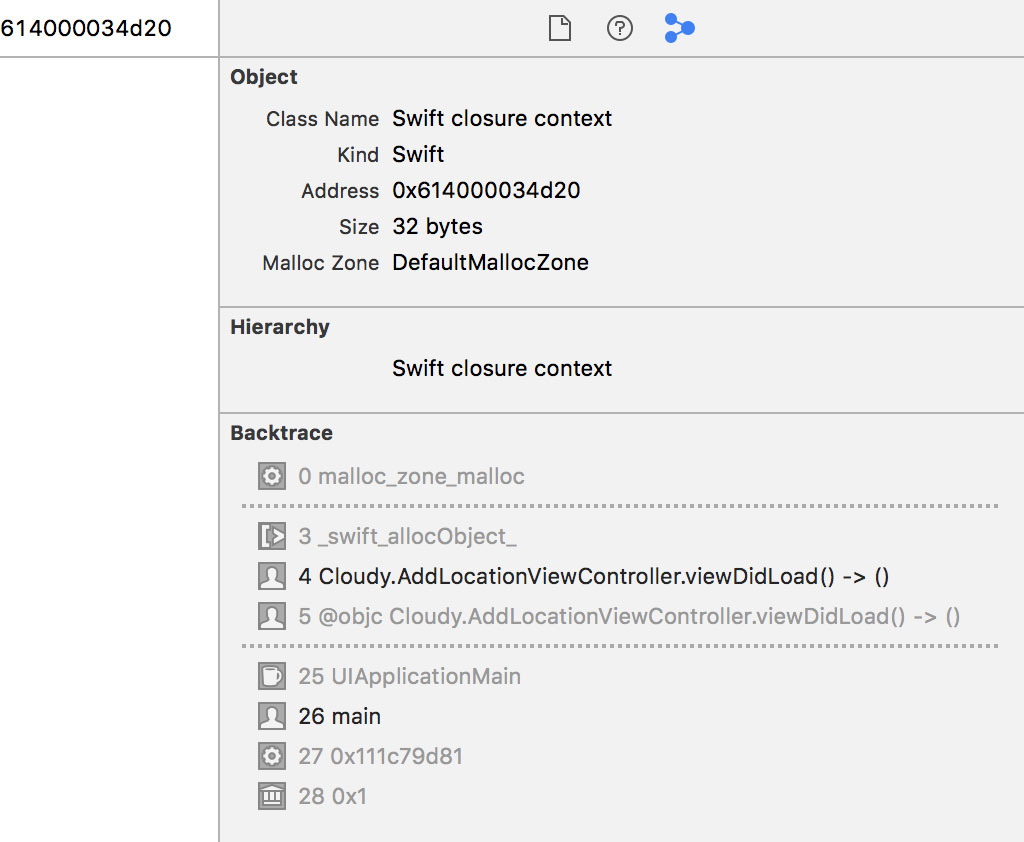
The allocation history reveals that the closure was instantiated in the viewDidLoad() method of the AddLocationViewController class. Hover over the stack frame in the Memory Inspector and click the small arrow that appears on the right to navigate to the viewDidLoad() method of the AddLocationViewController class.
In the viewDidLoad() method, we use reactive programming to respond to taps of the search button. This is nothing more than a reactive wrapper for the searchBarSearchButtonClicked(_:) method of the UISearchBarDelegate protocol.
// MARK: - View Life Cycle

override func viewDidLoad() {
    ...

    // Search Button Clicked
    searchBar.rx.searchButtonClicked
        .asDriver(onErrorJustReturn: ())
        .drive(onNext: {
            self.searchBar.resignFirstResponder()
        })
        .disposed(by: disposeBag)

    ...
}
In the drive(onNext:onCompleted:onDisposed:) method, we resign the search bar as the first responder to dismiss the keyboard. Do you spot the problem?
In the closure we pass to the drive(onNext:onCompleted:onDisposed:) method, we reference self, the AddLocationViewController instance. The closure strongly references the view controller. Because the AddLocationViewController instance also holds a strong reference to the search bar, we end up with another strong reference cycle.
The solution is simple. We weakly capture the AddLocationViewController instance in the closure to break the strong reference cycle.
// MARK: - View Life Cycle

override func viewDidLoad() {
    ...

    // Search Button Clicked
    searchBar.rx.searchButtonClicked
        .asDriver(onErrorJustReturn: ())
        .drive(onNext: { [weak self] in
            self.searchBar.resignFirstResponder()
        })
        .disposed(by: disposeBag)

    ...
}
Run the application one more time to make sure the solution we applied resolved the memory issue.
What's Next?
The last example illustrates how easy it is to create memory issues if you're not paying attention. Even though we no longer need to manually retain and release the objects we work with, memory management continues to be an important aspect of modern software development.
You can read more about memory management on Cocoacasts. Make sure you understand the difference between strong, weak, and unowned references. Memory management is as fundamental as understanding the difference between the var and let keywords.